Published: 2026-02-06T04:49:10.000Z
Chart USD/IDR Updates: Extending gains
10
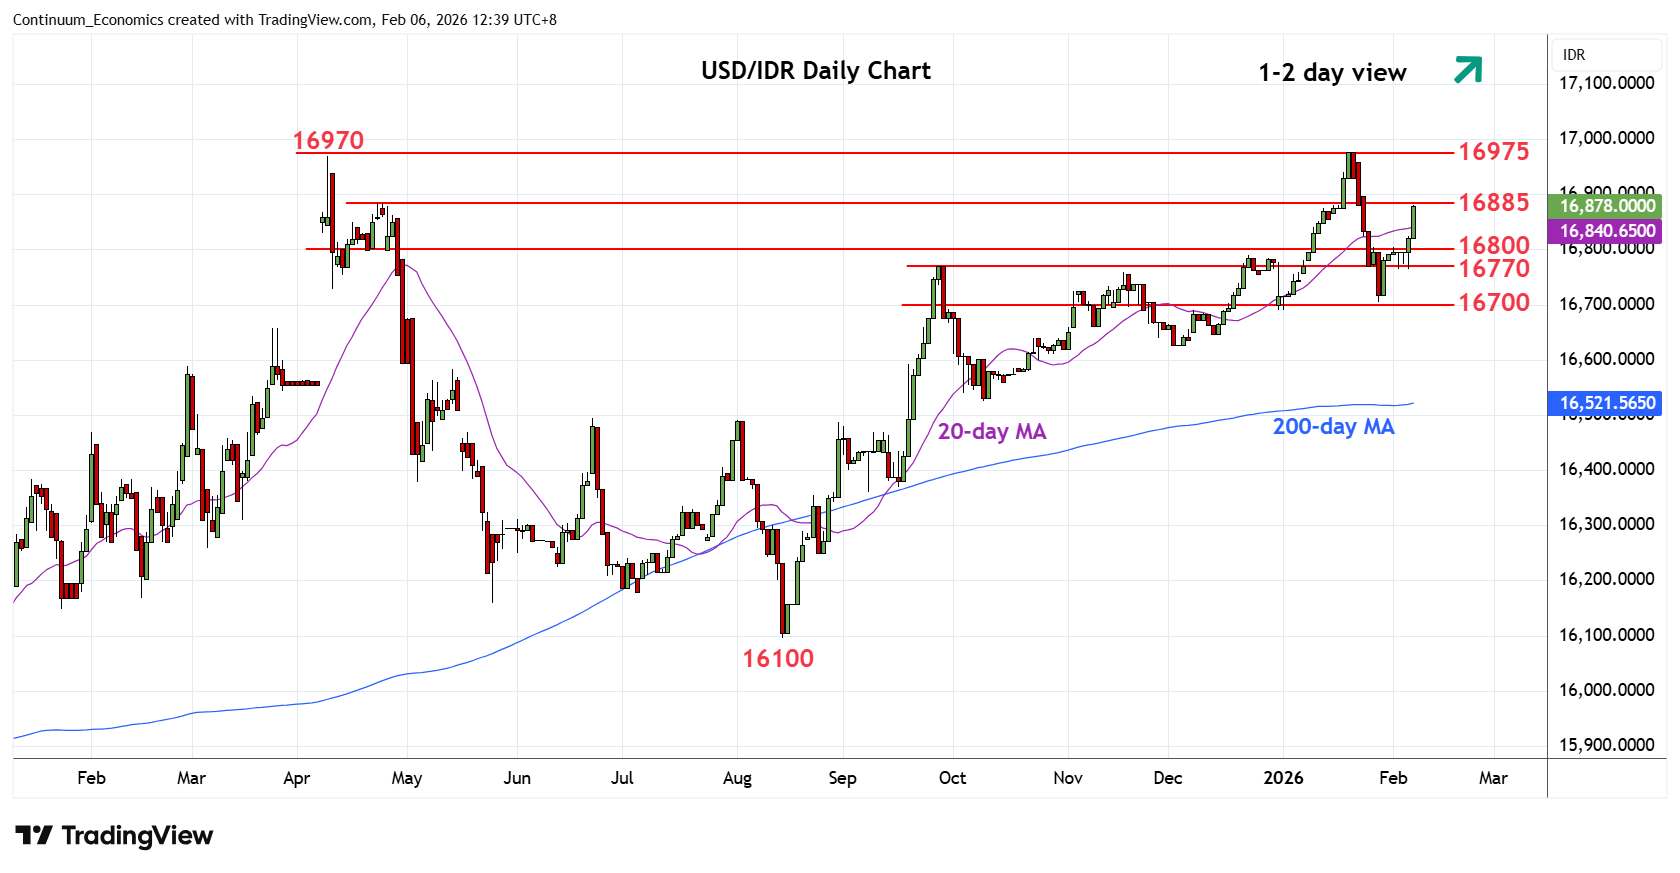
Break above the resistance at the 16800 level see prices retracing the January losses towards the 16885/16900 area
| Levels | Imp | Comment | Levels | Imp | Comment | |||
|---|---|---|---|---|---|---|---|---|
| R4 | 17050 | * | projection | S1 | 16770 | * | Sep high | |
| R3 | 16975 | ** | 20 Jan all-time high | S2 | 16705 | ** | Jan low | |
| R2 | 16930 | * | congestion | S3 | 16690 | * | 31 Dec low | |
| R1 | 16885 | * | 23 Apr high | S4 | 16640 | * | 38.2% Aug/Jan rally |
Asterisk denotes strength of level
04:40 GMT - Break above the resistance at the 16800 level see prices retracing the January losses towards the 16885/16900 area. Clearance here, if seen, will expose the 16970/16975, 2025 and January historic highs to retest. These highs are expected to cap and lower high sought for pullback later. Meanwhile support is raised to the 16800/16770 congestion area. Break here will return focus to the 16705 low and see room for deeper pullback to retrace the August/January gains.