Published: 2026-04-02T02:32:03.000Z
Chart USD/SGD Update: Higher in consolidation above 1.2800
-
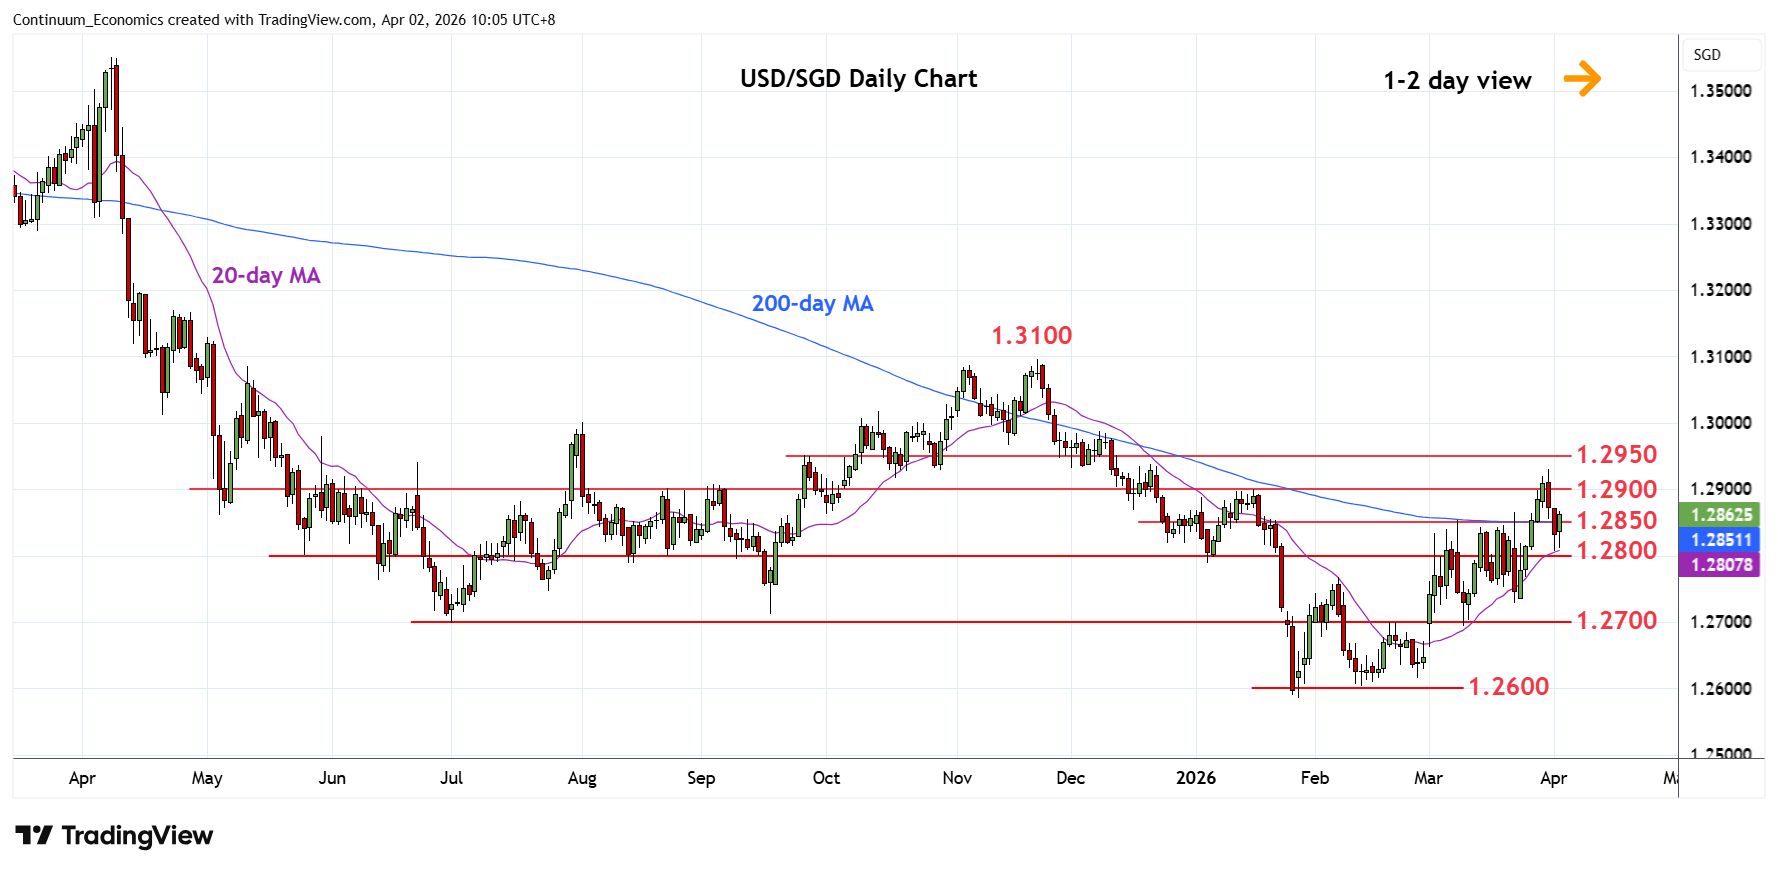
Higher in range above the 1.2800 level as prices unwind oversold intraday studies
| Level | Comment | Level | Comment | ||||
|---|---|---|---|---|---|---|---|
| R4 | 1.2975 | * | 76.4% Nov/Jan fall | S1 | 1.2800 | * | congestion |
| R3 | 1.2950 | * | congestion | S2 | 1.2730 | ** | 23 Mar low |
| R2 | 1.2930 | ** | 31 Mar YTD high | S3 | 1.2700 | ** | 19 Feb high, 2025 yr low |
| R1 | 1.2900 | * | congestion | S4 | 1.2650 | congestion |
Asterisk denotes strength of level
02:20 GMT - Higher in range above the 1.2800 level as prices unwind oversold intraday studies. Bounce from the 1.2807 low above congestion at 1.2850 sets up scope for retest of the 1.2900 level and 1.2930, 31 March current year high. Clearance will further retrace losses from the November high and see room to 1.2976, 76.4% Fibonacci retracement. Meanwhile, support at 1.2807/00 low and congestion are should underpin. Below this will open up room for deeper pullback to strong support at the 1.2768/30, February high/23 March higher low.