Published: 2026-01-23T04:12:58.000Z
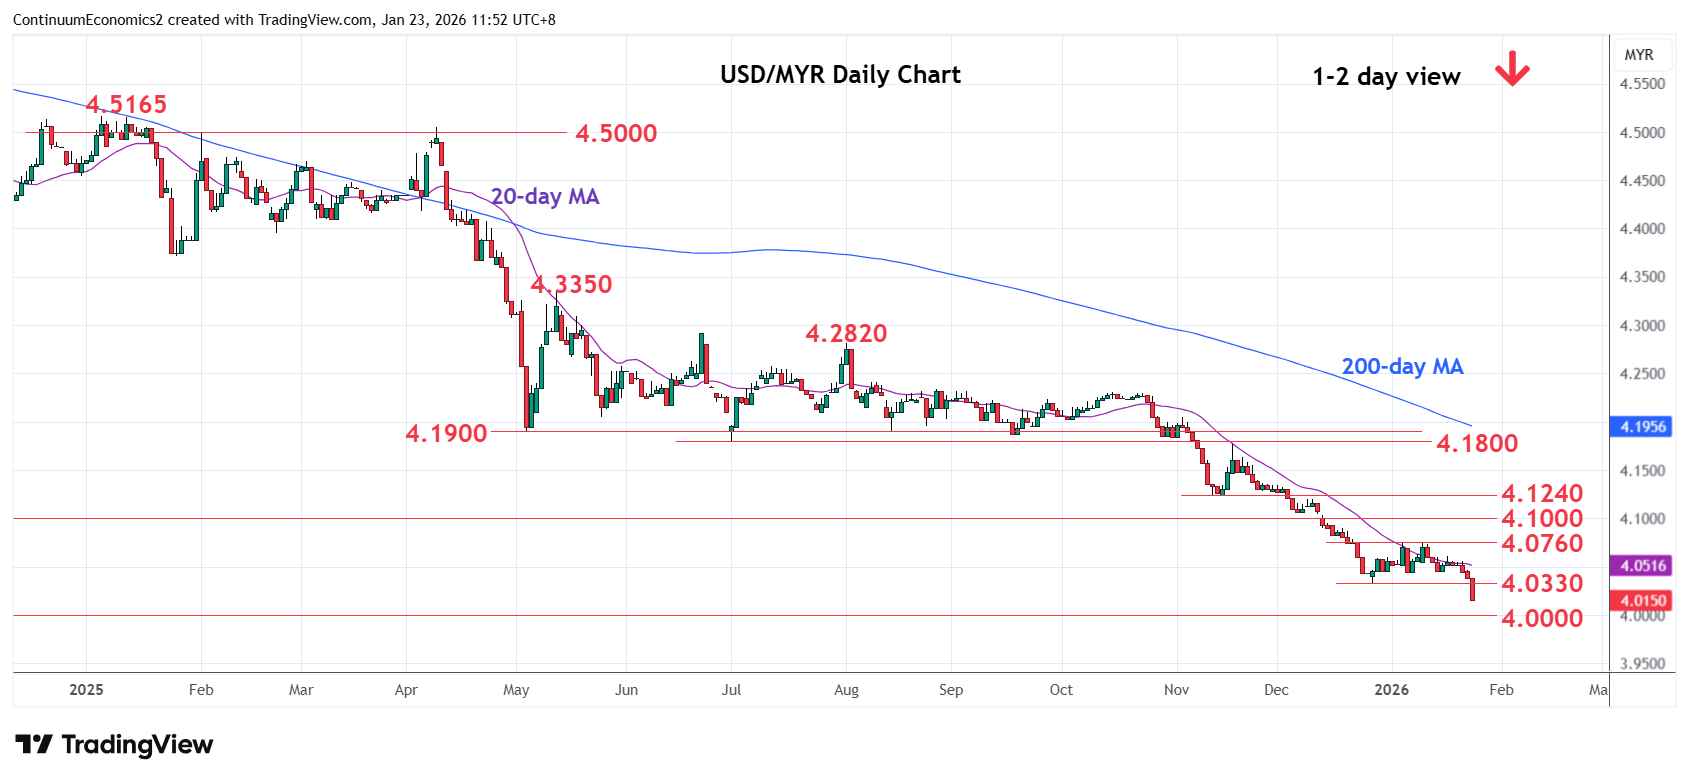
Chart USD/MYR Update: Under pressure, focus on 4.0000
-
Break of the 4.0330 December 2025 year low see prices extending losses from the 2024 year high
| Levels | Imp | Comment | Levels | Imp | Comment | |||
|---|---|---|---|---|---|---|---|---|
| R4 | 4.1000 | ** | Sep 2024 year low | S1 | 4.0000 | ** | Jan 2021 year low | |
| R3 | 4.0760 | ** | 5 Jan high, | S2 | 3.9700 | * | Jun 2018 low | |
| R2 | 4.0600 | * | congestion | S3 | 3.9500 | * | congestion | |
| R1 | 4.0330 | * | Dec 2025 year low | S4 | 3.9300 | * | congestion |
Asterisk denotes strength of level
04:10 GMT - Break of the 4.0330 December 2025 year low see prices extending losses from the 2024 year high. Negative daily and weekly studies keeps pressure on the downside and see room for retest of the 4.0000 figure and the January 2021 year low. Would expect reaction at the latter but a later break will open up room for further losses to 3.9700, June 2018 low. Meanwhile, resistance is lowered to the low of last year at 4.0330 which is expected to cap. Above here will see room for stronger corrective bounce to the 4.0600/4.0760 resistance.