Published: 2026-01-06T02:16:57.000Z
Chart USD/SGD Update: Under pressure
1
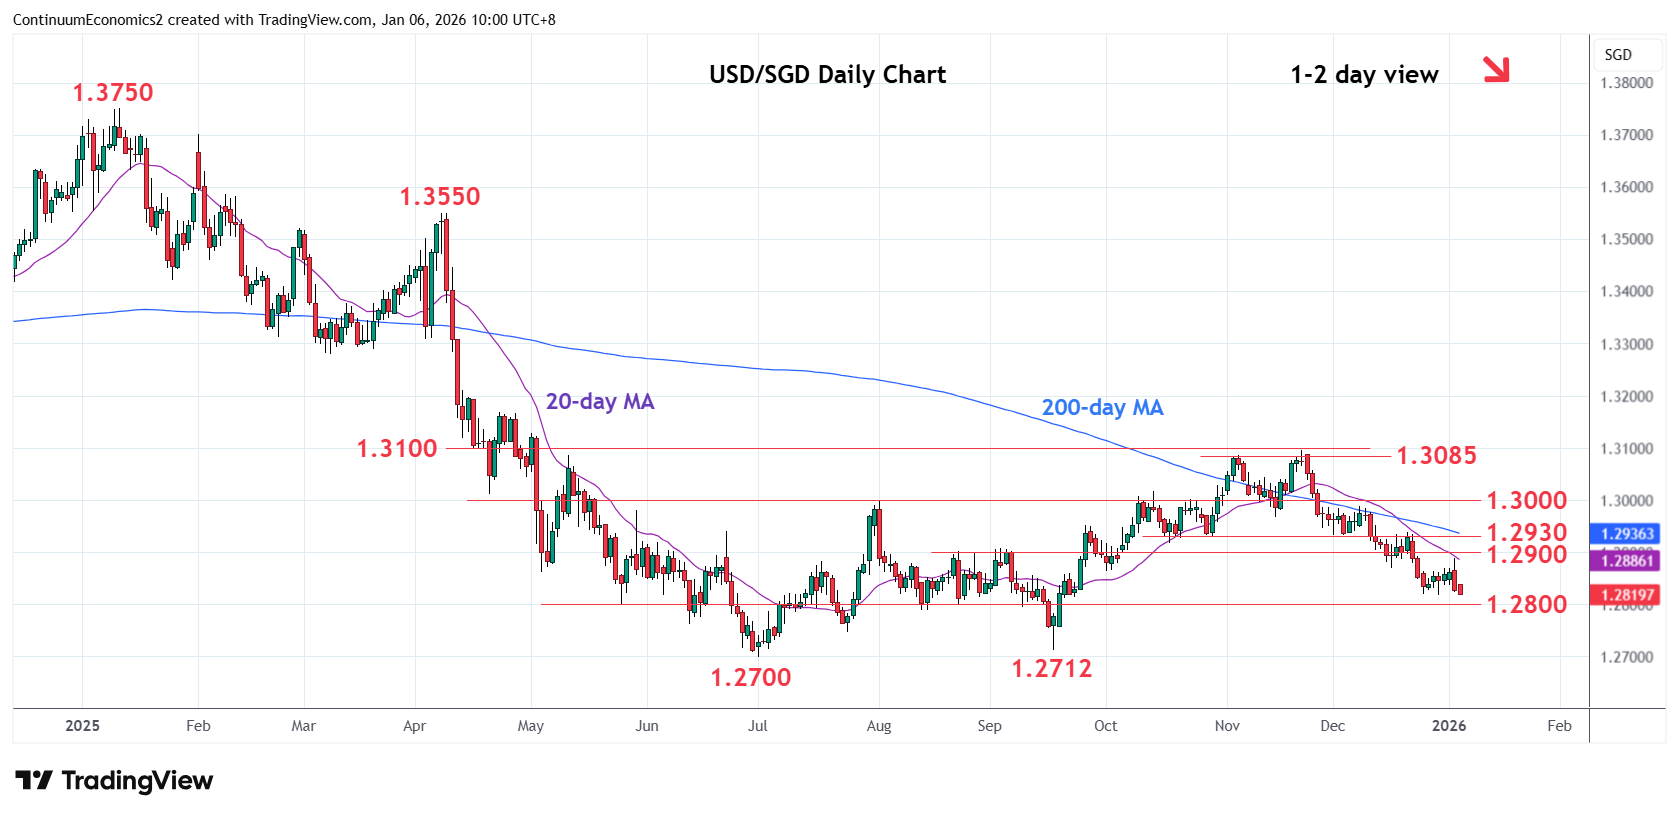
Consolidation above the 1.2818 low has given way to selling pressure beneath the 1.2900 level
| Level | Comment | Level | Comment | ||||
|---|---|---|---|---|---|---|---|
| R4 | 1.3085/100 | ** | 12 May high, congestion | S1 | 1.2818 | ** | 30 Dec low |
| R3 | 1.2980/00 | ** | congestion, Aug high | S2 | 1.2800 | * | congestion |
| R2 | 1.2930 | * | congestion | S3 | 1.2750 | * | congestion |
| R1 | 1.2900 | * | congestion | S4 | 1.2712/00 | ** | Sep, Jul 2025 year low |
Asterisk denotes strength of level
02:10 GMT - Consolidation above the 1.2818 low has given way to selling pressure beneath the 1.2900 level. Pressure return to the downside and threatens break of the 1.2818 low and the 1.2800 support. Break of these will see room for deeper pullback to 1.2750 congestion though focus will return to the 1.2712/1.2700, September/July lows. Deep oversold weekly studies suggest reaction at the latter likely. Meanwhile, resistance at the 1.2900 level is expected to cap and sustain losses from the 1.3100, November swing high.