Published: 2026-01-05T03:17:38.000Z
Chart USD/CNH Update: Edged up in range from 6.9663 low
1
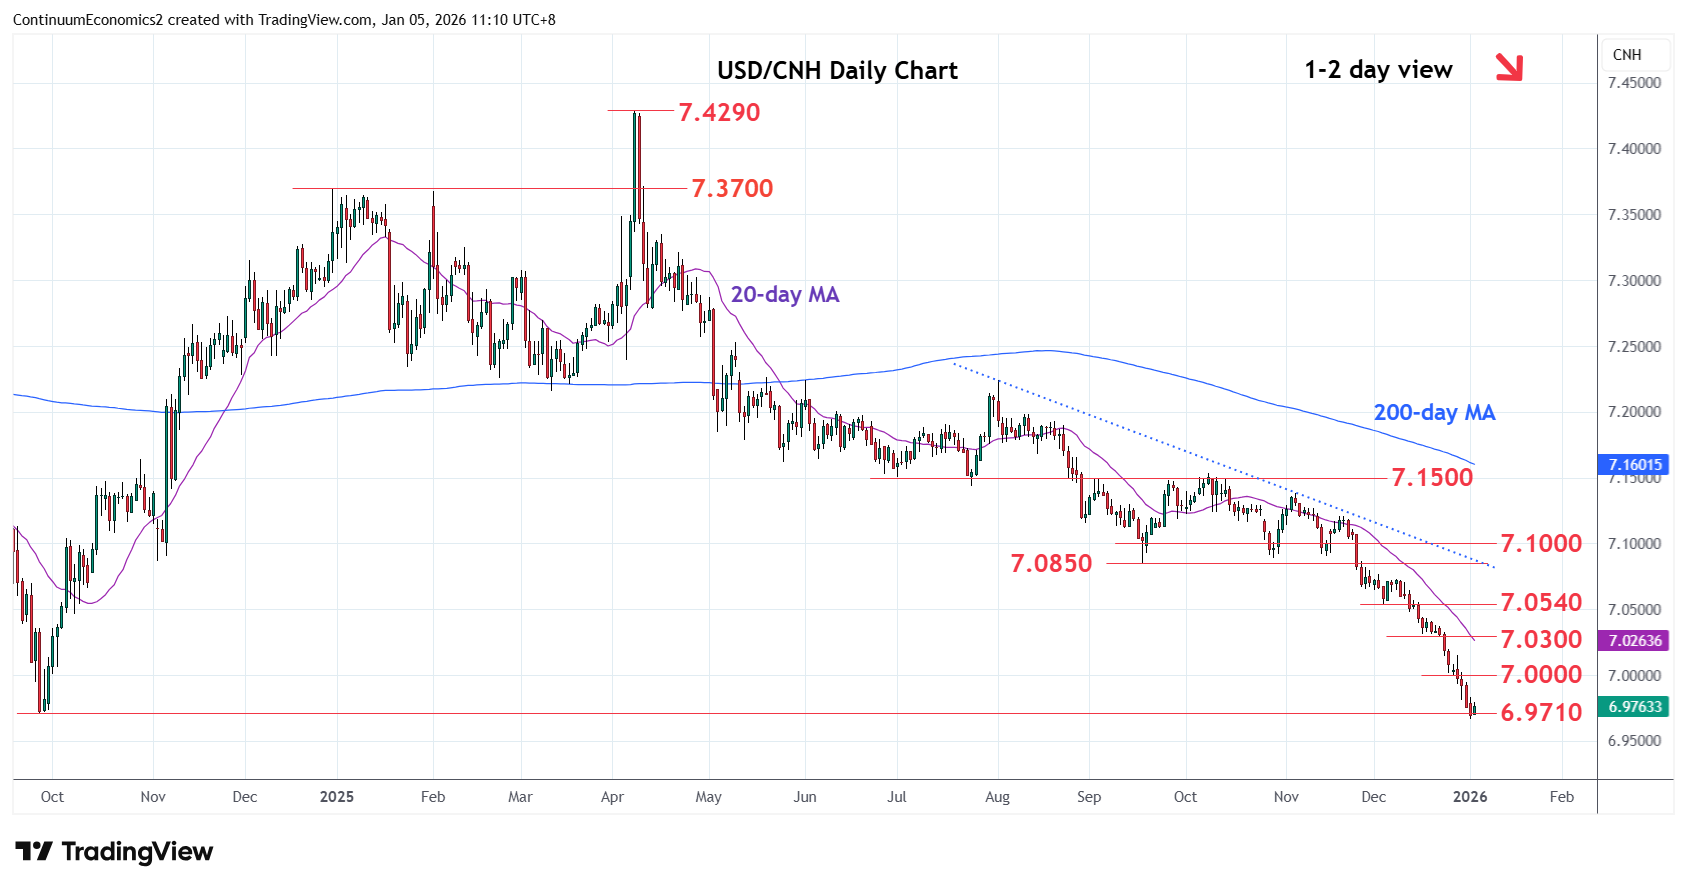
Limited on break of the 6.9710, September 2024 year low, as prices turned up in consolidation 6.9663 low
| Level | Imp | Comment | Level | Imp | Comment | |||
|---|---|---|---|---|---|---|---|---|
| R4 | 7.0730 | * | 8 Dec high | S1 | 6.9663 | * | 2 Jan low | |
| R3 | 7.0500/40 | ** | congestion, 3 Dec low | S2 | 6.9645 | * | 2 May 2023 high | |
| R2 | 7.0300 | * | congestion | S3 | 6.9500 | * | congestion | |
| R1 | 7.0000 | * | congestion | S4 | 6.9300 | * | congestion |
Asterisk denotes strength of level
03:15 GMT - Limited on break of the 6.9710, September 2024 year low, as prices turned up in consolidation 6.9663 low to unwind oversold intraday studies. Daily studies are stretched as well and caution corrective bounce. However, the downside remains vulnerable and lower will further extend losses from the April 2025 year high and see room to support at the 6.9645/6.9500 area. Meanwhile, resistance at the 7.0000 figure now expected to cap bounce attempt. Regaining this is needed to fade the downside pressure and corrective losses from October swing high.