Published: 2026-03-31T05:40:28.000Z
Chart USD/IDR Updates: Extending gains
1
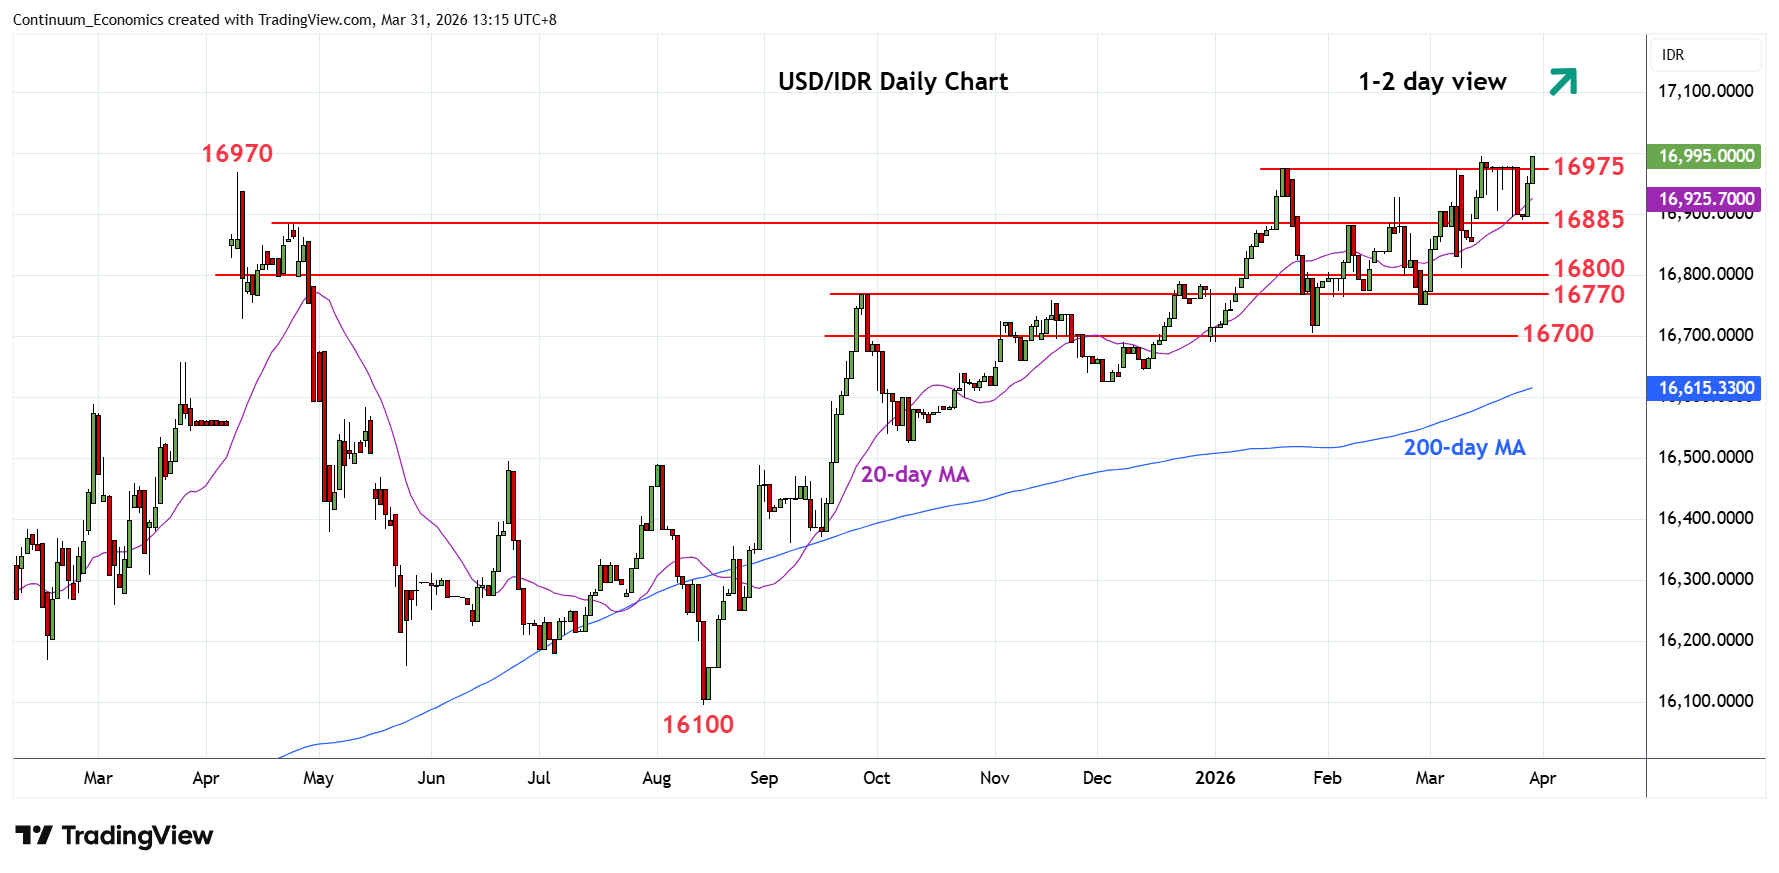
Pressuring the 16975/16995 historic highs and break here will further extend the underlying bull trend
| Levels | Imp | Comment | Levels | Imp | Comment | |||
|---|---|---|---|---|---|---|---|---|
| R4 | 18000 | figure | S1 | 16885 | * | congestion | ||
| R3 | 17600 | projection | S2 | 16800 | * | congestion | ||
| R2 | 17200 | projection | S3 | 16755 | ** | Feb low | ||
| R1 | 16995 | ** | 16 Mar all-time high | S4 | 16705 | ** | 28 Jan YTD low |
Asterisk denotes strength of level
05:30 GMT - Pressuring the 16975/16995 historic highs and break here will further extend the underlying bull trend. Break to fresh high will see room for extension to the 17200 and 17600 projection targets as bullish structure keep focus firmly on the upside. Meanwhile, support at the 16900/16885 congestion area underpin. Would need break here to ease the upside pressure and open up room for deeper pullback to retrace recent choppy gains from to the 16800 congestion. Below this will see room for deeper pullback to the 16755/16705, February low and 28 January YTD low.