Published: 2026-04-29T02:24:00.000Z
Chart USD/SGD Update: Consolidating
2
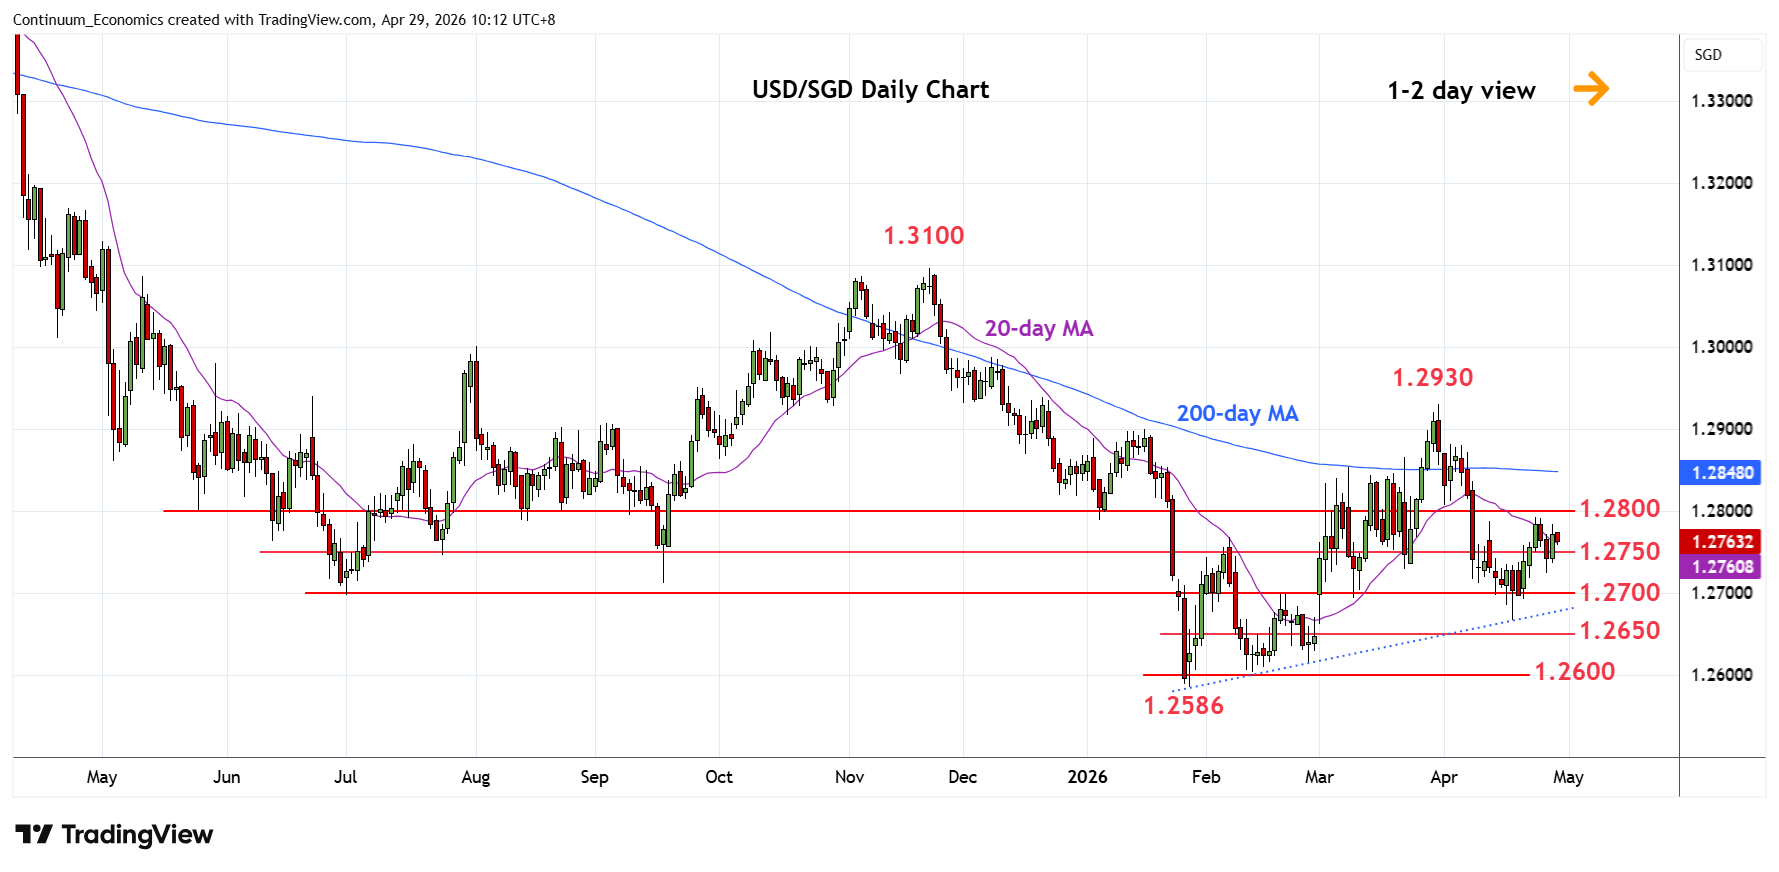
Back in consolidation above 1.2750 following bounce from 1.2725 Monday's low
| Level | Comment | Level | Comment | ||||
|---|---|---|---|---|---|---|---|
| R4 | 1.2900 | * | Jan high | S1 | 1.2725 | 27 Apr low | |
| R3 | 1.2850 | * | congestion | S2 | 1.2700 | ** | 19 Feb high, 2025 yr low |
| R2 | 1.2800/07 | ** | congestion, 1 Apr low | S3 | 1.2667 | * | 17 Apr low |
| R1 | 1.2790 | congestion | S4 | 1.2650 | congestion |
Asterisk denotes strength of level
02:20 GMT - Back in consolidation above 1.2750 following bounce from 1.2725 Monday's low. Resistance is at the 1.2790 congestion which extend to the 1.2800/07 congestion area which is expected to cap. Break here, if seen, will see room for stronger corrective bounce to resistance at 1.2850 congestion. Corrective gains are expected to give way to selling pressure later to retest the 1.2700 level then the 1.2667, 17 April low. Break of the latter will see deeper pullback to retrace the January/March gains and see extension to 1.2650. Below this will open up room to retest the 1.2600 level then the 1.2586 low.