Published: 2026-04-16T02:52:11.000Z
Chart USD/THB Update: Weighing on 32.00/31.89 support
1
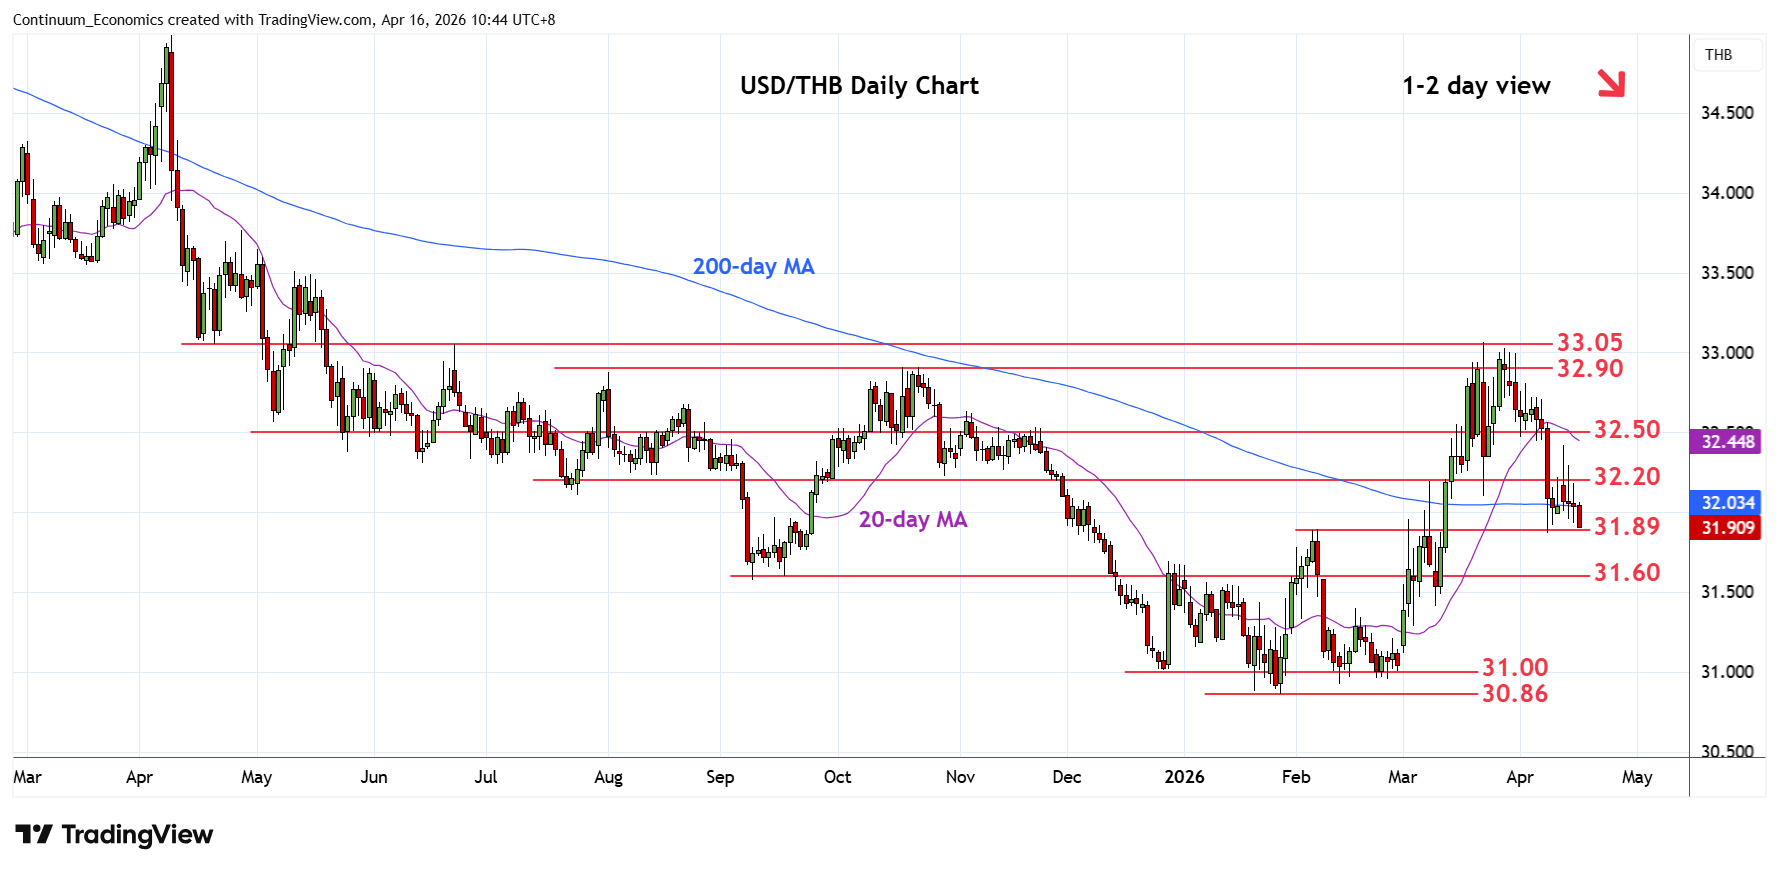
Leaning lower in choppy trade to pressure the 32.00/31.89 support
| Level | Comment | Level | Comment | |||||
|---|---|---|---|---|---|---|---|---|
| R4 | 32.70 | * | congestion | S1 | 31.89 | ** | Feb high | |
| R3 | 32.60 | * | congestion | S2 | 31.70 | * | 61.8% Jan/Mar rally | |
| R2 | 32.40/50 | ** | congestion | S3 | 31.60/58 | ** | congestion, 2025 yr low | |
| R1 | 32.20 | * | congestion | S4 | 31.50 | congestion |
Asterisk denotes strength of level
02:50 GMT - Leaning lower in choppy trade to pressure the 32.00/31.89 support following rejection from Monday's 32.42 apike high. Break of the 31.89 support will further retrace the January/March rally and see room to 31.70, 61.8% Fibonacci retracement. Lower still, will open up room to strong support at the 31.60/31.58, congestion and 2025 year low. Meanwhile, resistance remains at the 32.20 congestion which is expected to cap and sustain choppy losses from the 33.05, March current year high.