Chart USD/MXN Update: Approaching strong support
Steady selling interest has accelerated
| Levels | Imp | Comment | Levels | Imp | Comment | |||
|---|---|---|---|---|---|---|---|---|
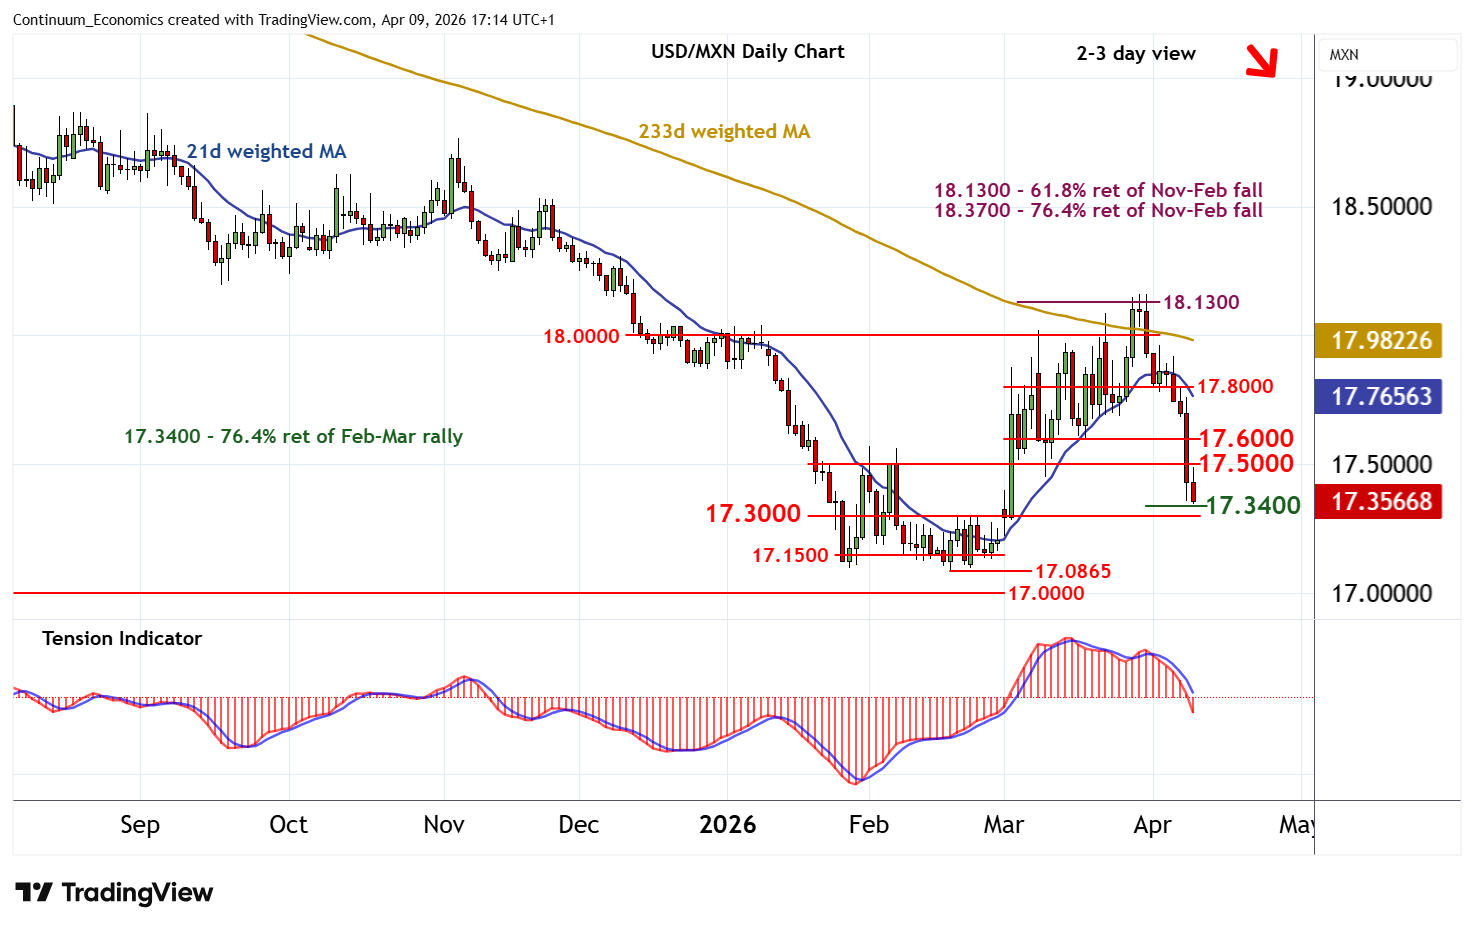
| R4 | 18.0000 | ** | break level | S1 | 17.3400 | ** | 76.4% ret of Feb-Mar rally | |
| R3 | 17.8000 | ** | congestion | S2 | 17.3000 | * | break level | |
| R2 | 17.6000 | ** | congestion | S3 | 17.1500 | * | congestion | |
| R1 | 17.5000 | ** | congestion | S4 | 17.0865 | ** | 18 Feb YTD low |
Asterisk denotes strength of level
17:00 BST - Steady selling interest has accelerated, with prices currently within reach of support at the 17.3400 Fibonacci retracement. Just beneath here is the 17.3000 break level. But flat oversold daily stochastics should limit any initial tests of this range in short-covering/consolidation, before the bearish daily Tension Indicator and unwinding overbought weekly stochastics prompt further losses. A close beneath here will add weight to sentiment and put focus on critical support at the 17.0865 current year low of 18 February. Meanwhile, resistance is at congestion around 17.5000 and extends to 17.6000. An unexpected close above this range will help to stabilise price action and prompt consolidation beneath further congestion around 17.8000.