Chart EUR/CAD Update: Extending losses
Anticipated losses have broken below 1.6000
| Level | Comment | Level | Comment | |||||
|---|---|---|---|---|---|---|---|---|
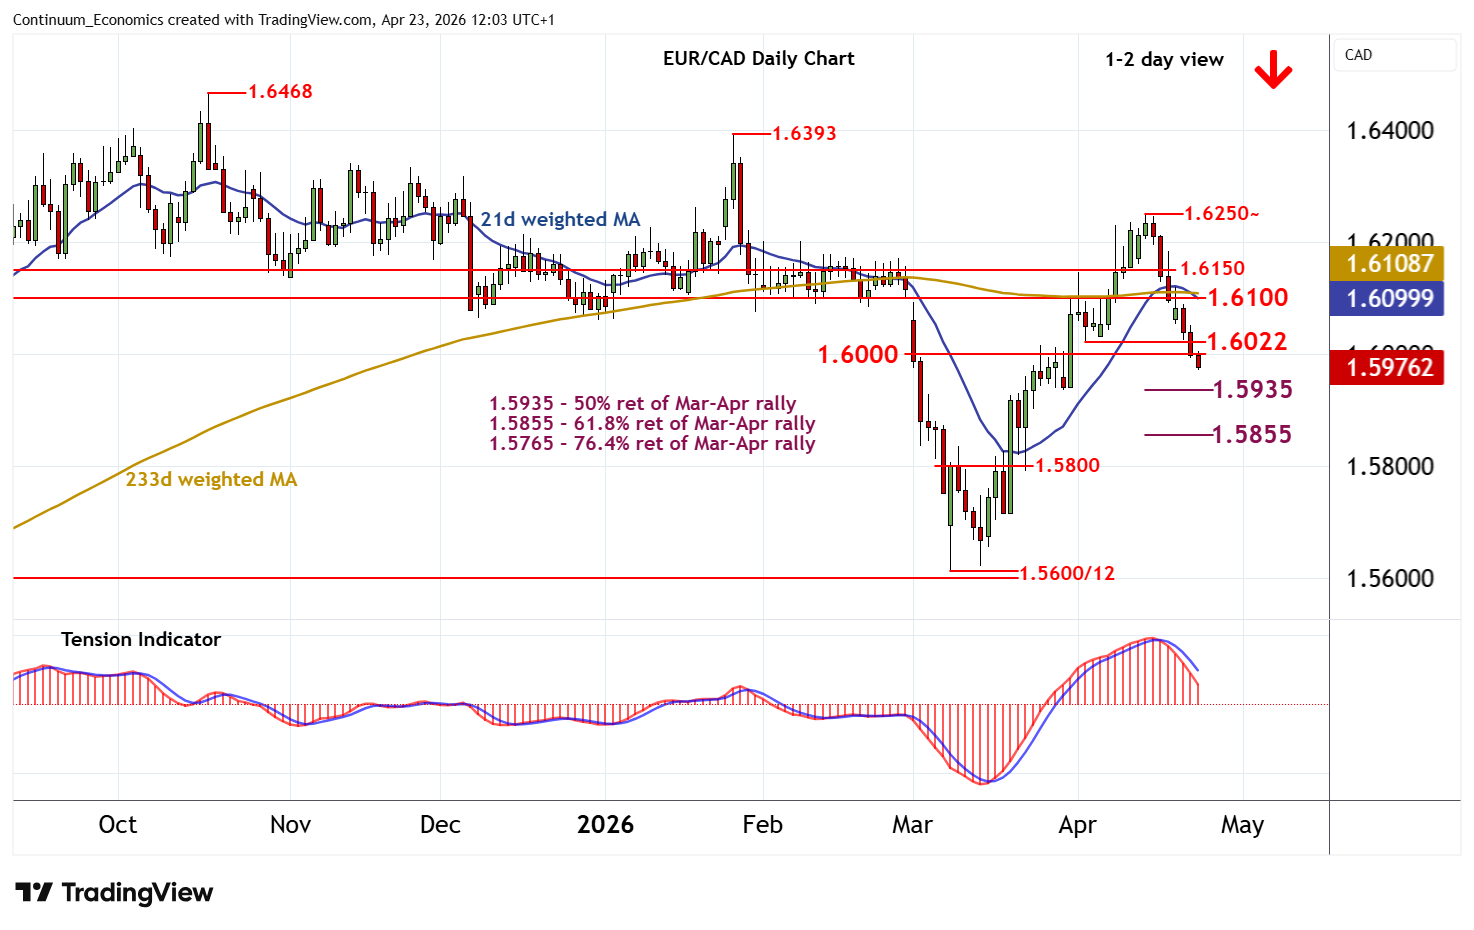
| R4 | 1.6150 | * | congestion | S1 | 1.5935 | ** | 50% ret of Mar-Apr rally | |
| R3 | 1.6100 | ** | break level | S2 | 1.5855 | ** | 61.8% ret of Mar-Apr rally | |
| R2 | 1.6022 | * | 2-6 Apr lows | S3 | 1.5800 | * | congestion | |
| R1 | 1.6000 | * | break level | S4 | 1.5765 | ** | 76.4% ret of Mar-Apr rally |
Asterisk denotes strength
11:55 BST - Anticipated losses have broken below 1.6000, as intraday studies continue to track lower, with prices currently trading around 1.5975. Daily readings are bearish and weekly stochastics are turning lower in overbought areas, suggesting room for further weakness in the coming sessions. Focus is on the 1.5935 Fibonacci retracement. Flat oversold daily stochastics could limit any initial tests in consolidation, before a further break extends mid-April losses towards the 1.5855 retracement. Meanwhile, resistance is lowered to the 1.6000 break level and extends to the 1.6022 lows from 2-6 April. A close above this range, if seen, will help to stabilise price action and prompt consolidation beneath 1.6100.