Published: 2026-03-18T02:27:25.000Z
Chart USD/SGD Update: Weighing on 1.2768 support
5
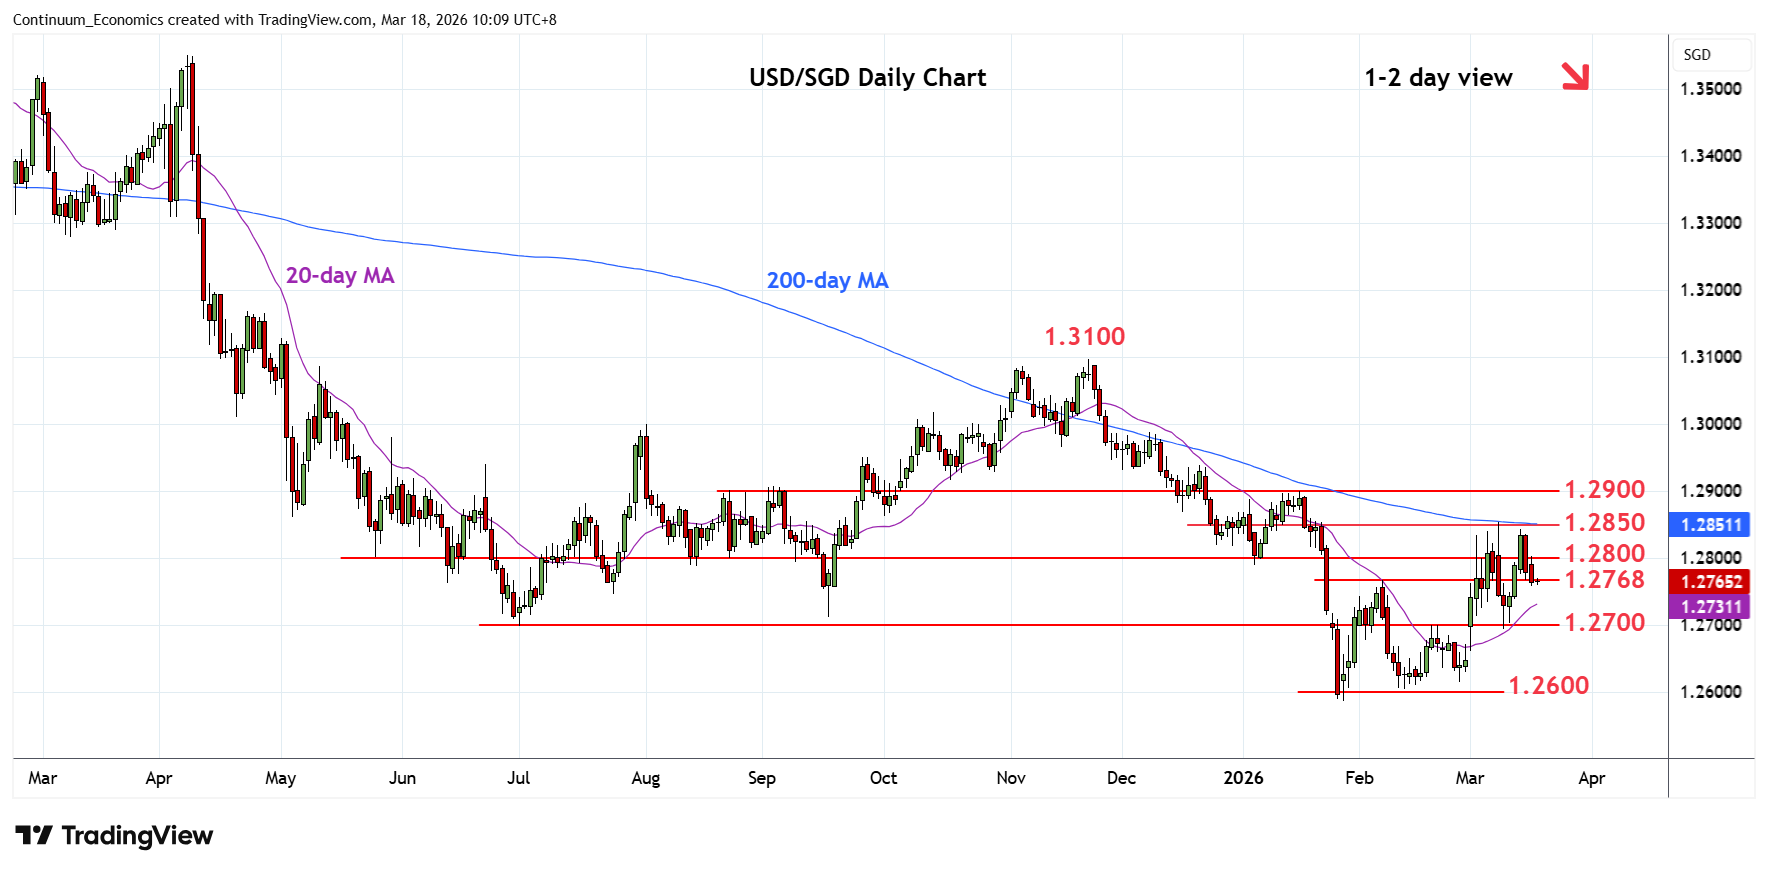
Extending rejection from resistance at the 1.2850 congestion and 200-day MA to pressure the 1.2768 support
| Level | Comment | Level | Comment | ||||
|---|---|---|---|---|---|---|---|
| R4 | 1.2938 | * | 19 Dec high | S1 | 1.2768 | ** | Feb high |
| R3 | 1.2900 | ** | 16 Jan YTD high, 61.8% | S2 | 1.2700 | ** | 19 Feb high, 2025 yr low |
| R2 | 1.2850 | ** | congestion, 200-day MA | S3 | 1.2650 | * | congestion |
| R1 | 1.2800 | * | congestion | S4 | 1.2586 | ** | 28 Jan YTD low |
Asterisk denotes strength of level
02:20 GMT - Extending rejection from resistance at the 1.2850 congestion and 200-day MA to pressure the 1.2768 support. Daily studies are tracking lower and hightlight scope for break here to open up room for retest of strong support at the 1.2700 level and 2025 year low. Below this will return focus to the downside for retest of 1.2650 congestion and the 1.2600/1.2586, February/January lows. Meanwhile, resistance is lowered to the 1.2800 congestion which is expected to cap and sustain losses from the 1.2850 resistance and 200-day MA.