Published: 2026-02-27T02:29:16.000Z
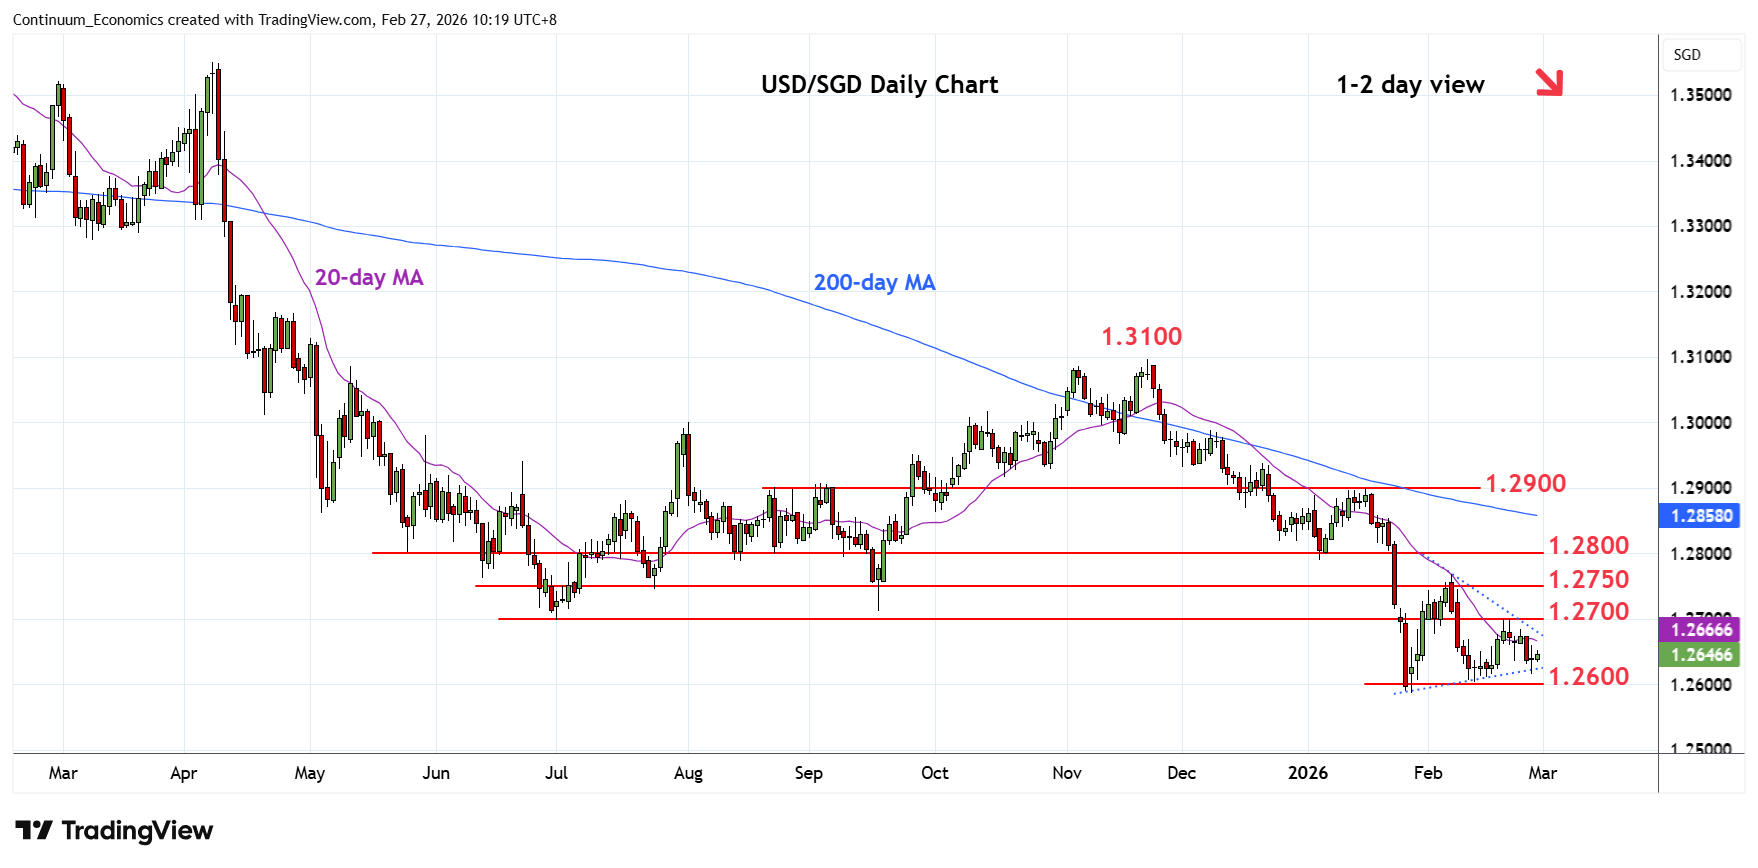
Chart USD/SGD Update: Extend consolidation within a 4-week triangle
1
Turned up in consolidation following bounce from the 1.2615 low
| Level | Comment | Level | Comment | ||||
|---|---|---|---|---|---|---|---|
| R4 | 1.2800 | ** | congestion | S1 | 1.2600 | * | congestion |
| R3 | 1.2780 | * | 38.2% Nov/Jan fall | S2 | 1.2586 | ** | 28 Jan YTD low |
| R2 | 1.2768 | ** | 6 Feb high | S3 | 1.2550 | * | congestion |
| R1 | 1.2700 | * | congestion | S4 | 1.2500 | * | congestion |
Asterisk denotes strength of level
02:25 GMT - Turned up in consolidation following bounce from the 1.2615 low as prices unwind oversold intraday studies. Consolidation above the latter see prices tracing out a broad 4-week triangle pattern and threaten break here and the 1.2600 level to extend the November losses from the 1.3100 high. Lower will extend the broader losses from the 2020 year high and see extension to the 1.2550/1.2500 congestion area. Meanwhile, resistance at the 1.2700 level is expected to cap and keep pressure on the downside. Only above here will fade the downside pressure and see room back to the 1.2750/1.2768 resistance.