Published: 2026-03-12T06:13:51.000Z
Chart USD/CNH Update: Higher in consolidation from 6.8600 low
1
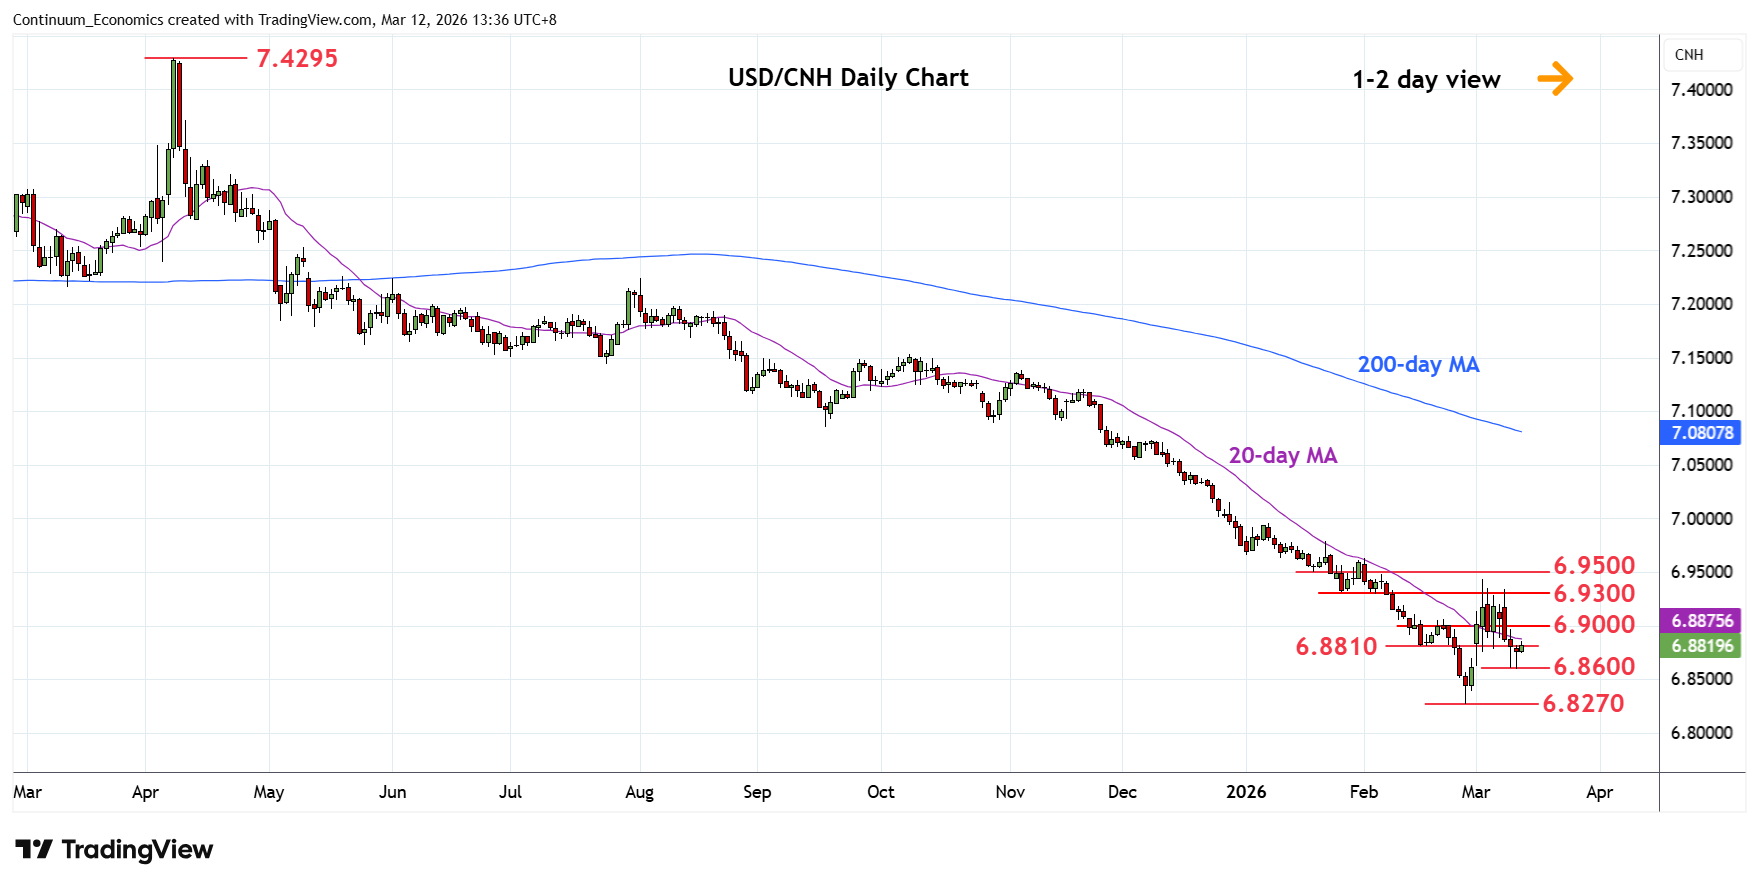
Bounce from the 6.8600 low see prices back to consolidate at the 6.8800 level
| Level | Imp | Comment | Level | Imp | Comment | |||
|---|---|---|---|---|---|---|---|---|
| R4 | 6.9700 | * | 2024 year low | S1 | 6.8600 | * | 11 Mar low | |
| R3 | 6.9500 | * | congestion | S2 | 6.8270 | ** | 26 Feb YTD low | |
| R2 | 6.9300 | * | Jan low, congestion | S3 | 6.8100 | * | Mar 2023 low | |
| R1 | 6.9000 | ** | low, congestion | S4 | 6.8000 | * | congestion |
Asterisk denotes strength of level
06:10 GMT - Bounce from the 6.8600 low see prices back to consolidate at the 6.8800 level. However, the downside remains vulnerable and and break of the 6.8600 low will expose the 6.8270 February YTD low to retest. Meanwhile, resistance is at the 6.9000 congestion which is expected to cap. Clearance here will ease the downside pressure and open up room for retest of resistance at the 6.9300/6.9500 area. Above here will extend corrective gains from the February low to resistance at the 6.9700, 2024 year low.