Published: 2026-01-09T03:01:28.000Z
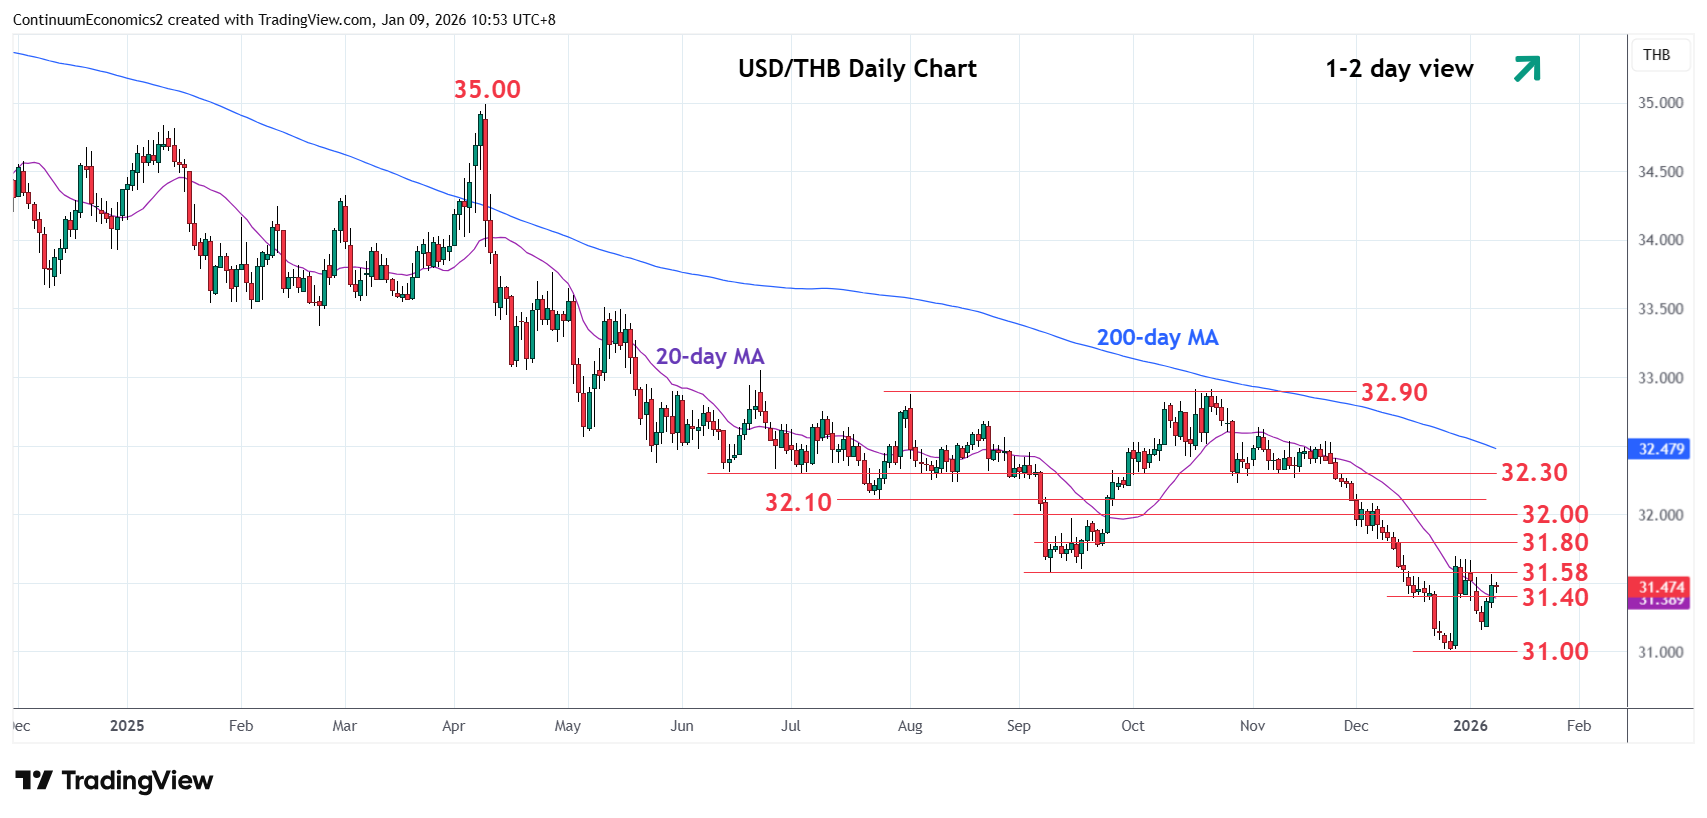
Chart USD/THB Update: Higher in consolidation from 31.00 low
-
Bounce from the 31.16 low see prices extending consolidation above the 31.00, December 2025 year low
| Level | Comment | Level | Comment | |||||
|---|---|---|---|---|---|---|---|---|
| R4 | 32.00 | * | figure, congestion | S1 | 31.16 | * | 6 Jan low | |
| R3 | 31.80 | * | congestion | S2 | 31.00 | ** | 26 Dec 2025 year low | |
| R2 | 31.70 | ** | 29 Dec high | S3 | 30.80 | * | Jun 2020 low | |
| R1 | 31.58 | * | Sep low | S4 | 30.60 | * | congestion |
Asterisk denotes strength of level
03:00 GMT - Bounce from the 31.16 low see prices extending consolidation above the 31.00, December 2025 year low. Daily studies are tracking higher to unwind oversold readings and see room to correct losses from the October swing high. Break above resistance at 31.58 congestion and 31.70 late-December high will open up room for stronger gains to the 31.80/32.00 area. Meanwhile, support is raised to 31.16 low then the 31.00, Decemer low. Break of these will extend the broader losses from the September 2022 year high and see room to support at the 30.80/30.60 congstion area.