Published: 2026-04-27T04:54:21.000Z
Chart USD/IDR Updates: Lower in consolidation from historic high
4
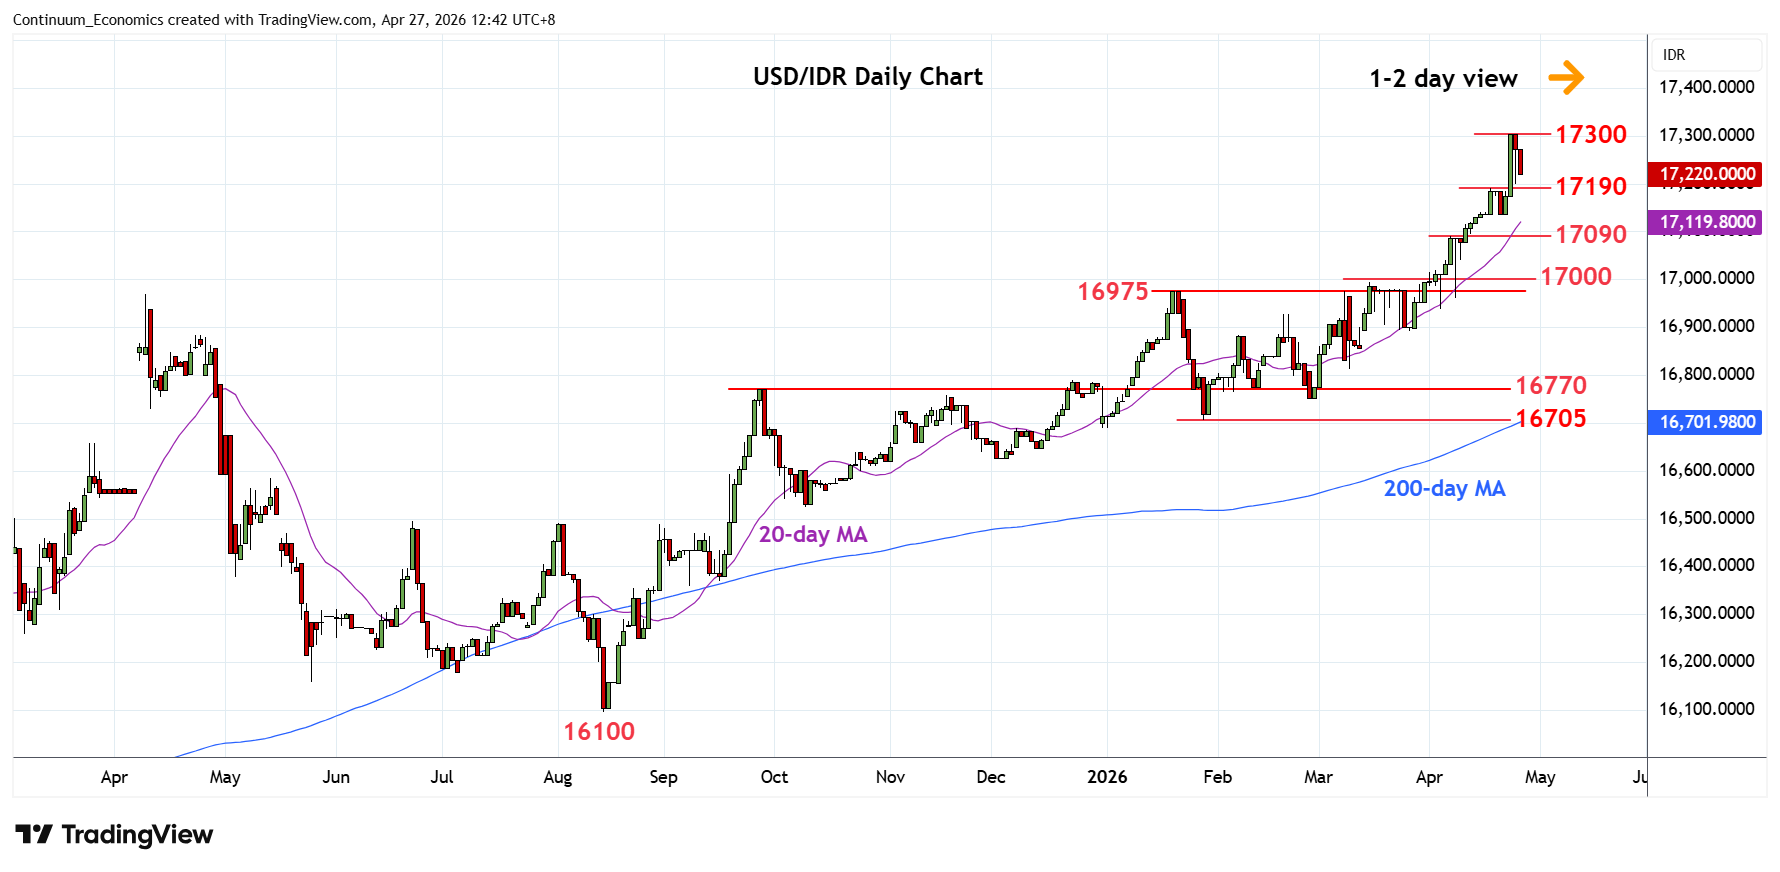
Lower in consolidation from the 17300 all-time high as prices unwind overbought daily studies
| Levels | Imp | Comment | Levels | Imp | Comment | |||
|---|---|---|---|---|---|---|---|---|
| R4 | 18000 | figure | S1 | 17190 | * | 17 Apr high | ||
| R3 | 17600 | projection | S2 | 17137 | 17 Apr low | |||
| R2 | 17500 | projection | S3 | 17100/090 | ** | congestion, 7 Apr high | ||
| R1 | 17300 | ** | 23 Apr all-time high | S4 | 17000 | ** | congestion |
Asterisk denotes strength of level
04:50 GMT - Lower in consolidation from the 17300 all-time high as prices unwind overbought daily studies. Weekly studies are stretched as well and suggest recent parabolic gains now being unwound. Pullback see support starting at 17200/17190 congestion and 17 April high. Break here will open up room for deeper correction of gains from the 16705 January low to the 17137 support and 17100 congestion. Meanwhile, resistance at the 17300 high expected to cap. Clearance, if seen, will see room for extension to the 17500/17600 projection target.