Published: 2026-05-04T02:42:17.000Z
Chart USD/SGD Update: Consolidating above 1.2700
-
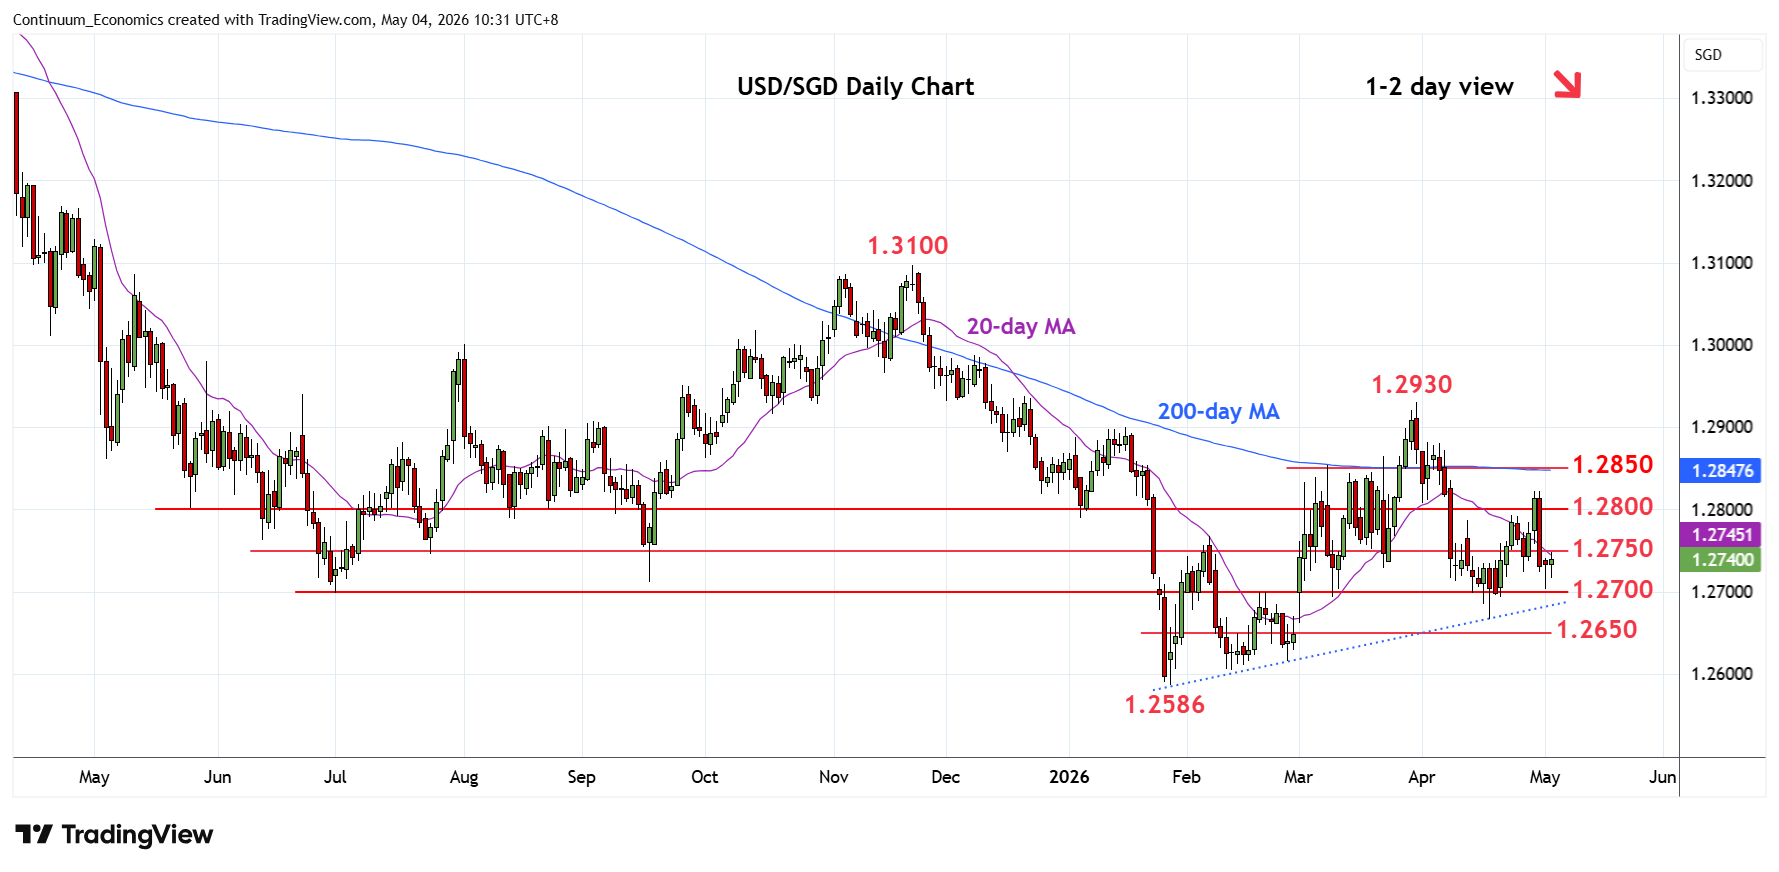
Turned up from above support at the 1.2700 congestion as prices consolidate losses from the 1.2823 high
| Level | Comment | Level | Comment | ||||
|---|---|---|---|---|---|---|---|
| R4 | 1.2850 | * | congestion | S1 | 1.2700 | ** | 19 Feb high, 2025 yr low |
| R3 | 1.2823 | ** | 29 Apr high | S2 | 1.2667 | ** | Apr low |
| R2 | 1.2800 | * | congestion | S3 | 1.2650 | * | congestion |
| R1 | 1.2750 | * | congestion | S4 | 1.2586 | ** | 28 Jan YTD low |
Asterisk denotes strength of level
02:35 GMT - Turned up from above support at the 1.2700 congestion as prices consolidate losses from the 1.2823 high. Consolidation is expected to give way to renewed selling pressure later, below the 1.2700 support will expose the 1.2667 April low and 1.2650 congestion to retest. Below these will return focus to th 1.2600 level and 1.2586 current year low of 28 January to retest. Meanwhile, resistance is lowered to 1.2750 congestion which is expected to cap and sustain losses from the 1.2823 high of last week.