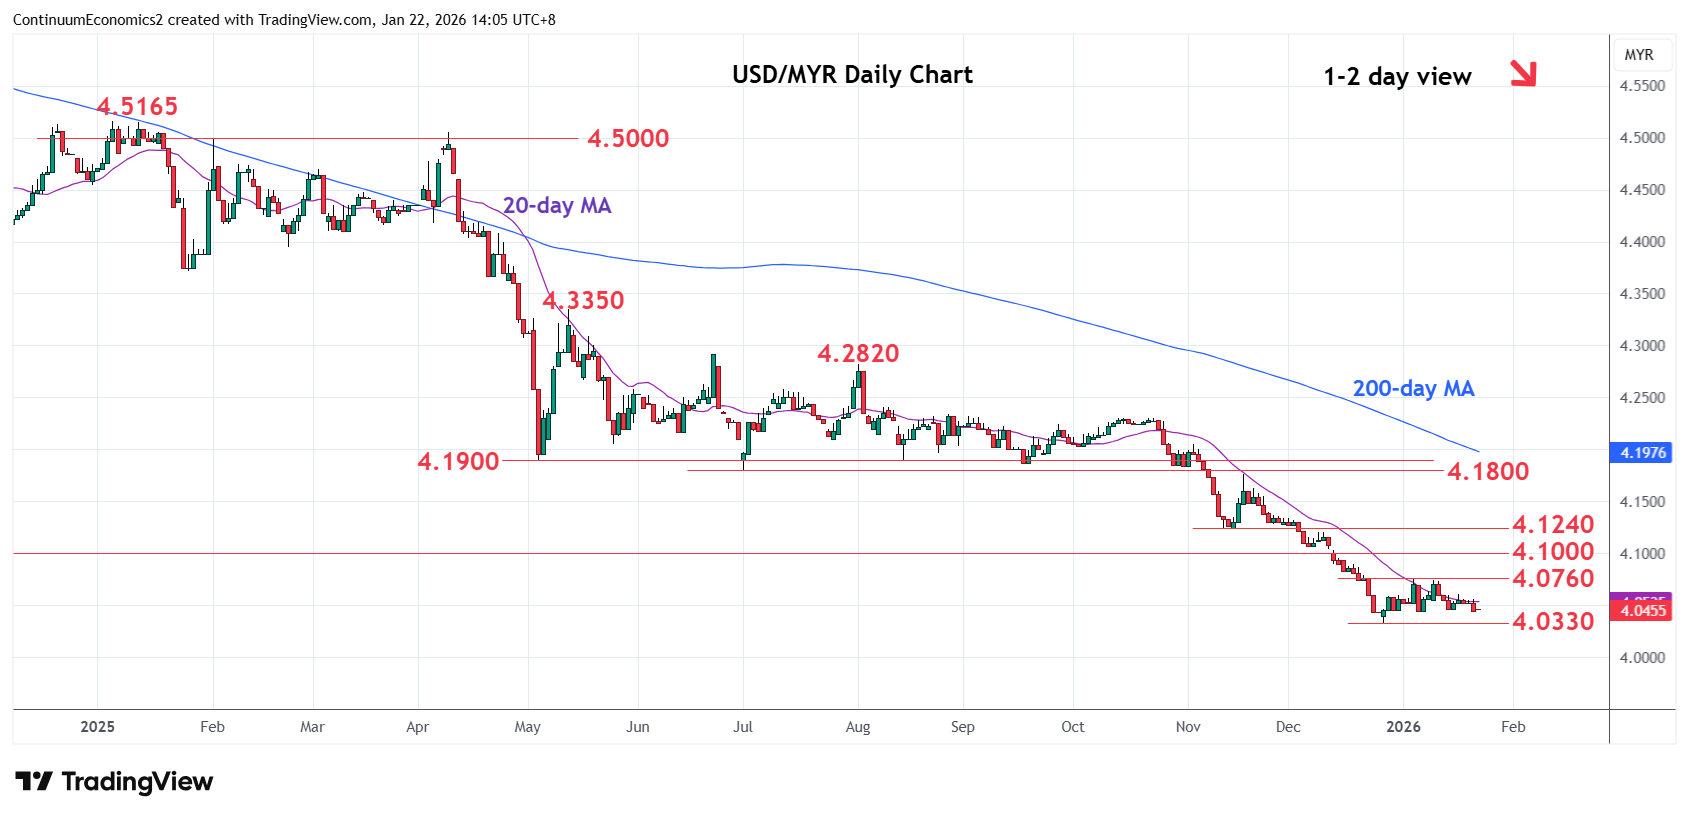
Chart USD/MYR Update: Leaning lower from 4.0760 resistance
Drift lower from the 4.0760 bounce high as prices and break below the 4.0500 level threatens retest of the 4.0330
| Levels | Imp | Comment | Levels | Imp | Comment | |||
|---|---|---|---|---|---|---|---|---|
| R4 | 4.1470/00 | * | 18 Nov low, congestion | S1 | 4.0330 | ** | 26 Dec 2025 year low | |
| R3 | 4.1240 | ** | 14 Nov low | S2 | 4.0280 | * | Feb 2021 low | |
| R2 | 4.1000 | ** | Sep 2024 year low | S3 | 4.0000 | ** | Jan 2021 year low | |
| R1 | 4.0760 | * | 5 Jan high | S4 | 3.9700 | * | Jun 2018 low |
Asterisk denotes strength of level
06:30 GMT - Drift lower from the 4.0760 bounce high as prices and break below the 4.0500 level threatens retest of the 4.0330 December 2025 year low. Negative daily studies threatens break here to extend losses from the February 2024 year high to support at 4.0280 low of February 2021. Lower still, will see room to the 4.0000 figure and the January 2021 year low. Meanwhile, resistance at the 4.0760 is expected to cap. Break here will delay bears and open up room for stronger corrective gains to retrace losses from the October swing high to resistance at the 4.1000 level and September 2024 year low.