Published: 2026-05-15T02:20:34.000Z
Chart USD/SGD Update: Extending gains
3
Break above the 1.2750 see prices extending bounce from the 1.2652 support to retrace losses from the 1.2930, 31 March current year high
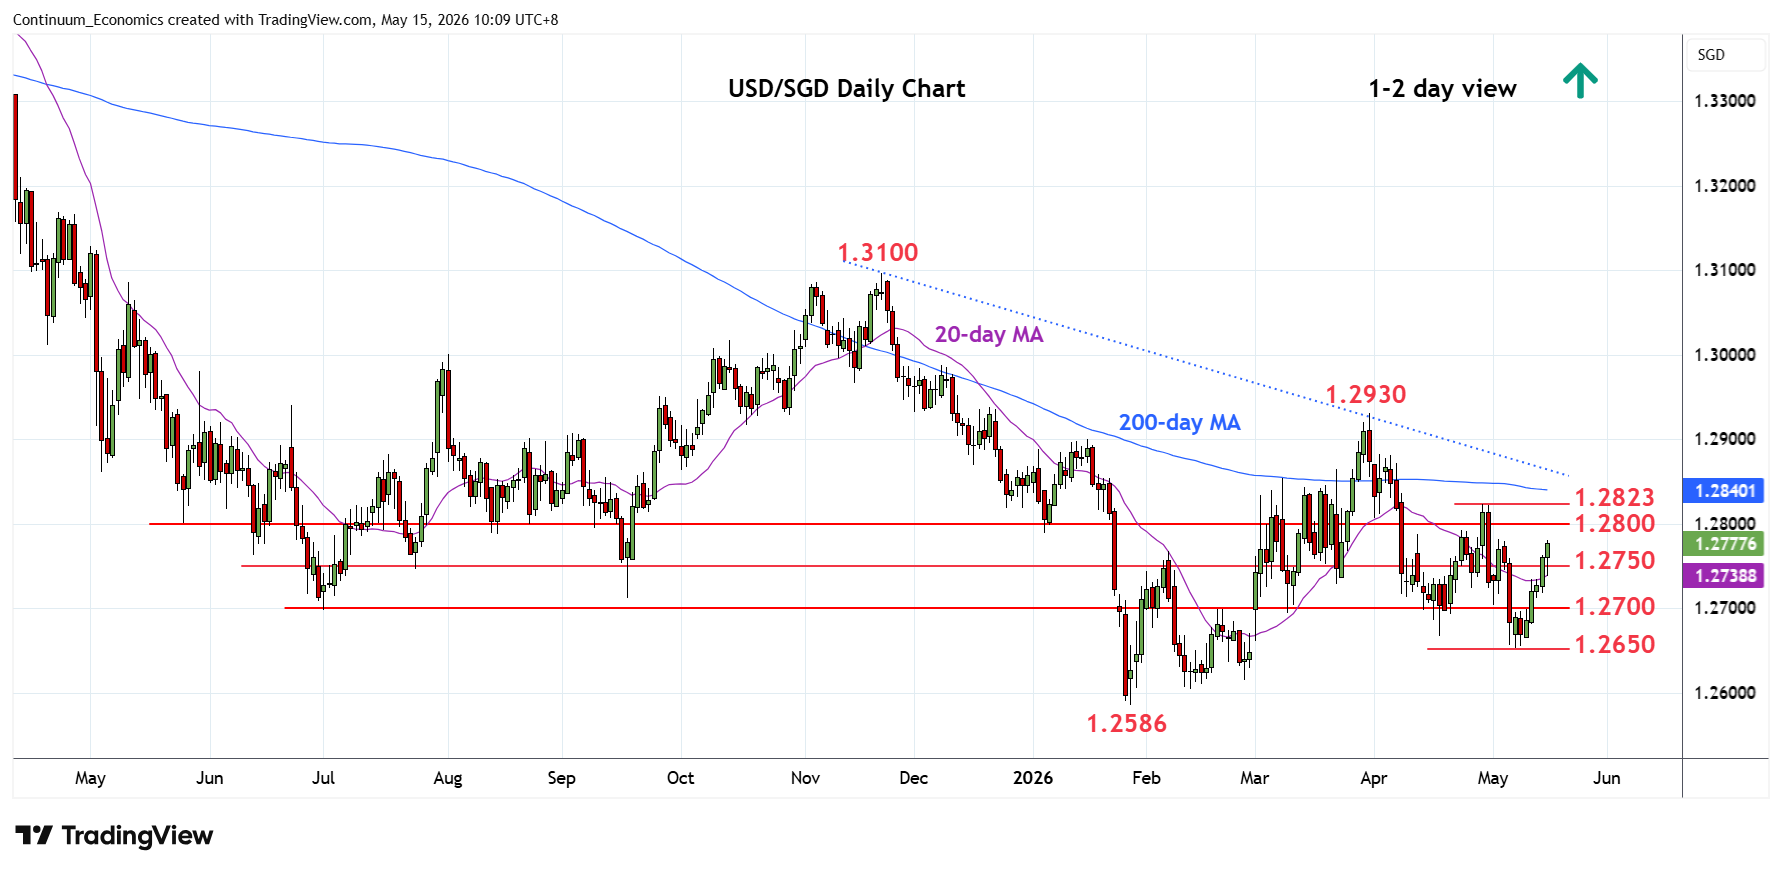
| Level | Comment | Level | Comment | ||||
|---|---|---|---|---|---|---|---|
| R4 | 1.2900 | * | congestion | S1 | 1.2750 | * | congestion |
| R3 | 1.2850/60 | * | congestion, trendline | S2 | 1.2700 | * | congestion |
| R2 | 1.2823 | ** | 29 Apr high | S3 | 1.2667 | * | Apr low |
| R1 | 1.2800 | * | congestion | S4 | 1.2650 | ** | 7 May low |
Asterisk denotes strength of level
02:15 GMT - Break above the 1.2750 see prices extending bounce from the 1.2652 support to retrace losses from the 1.2930, 31 March current year high. higher will see room to retest the 1.2800 congestion then the 1.2823 high of 29 April which is expected to cap. Break here, if seen, will see room for extension to the 1.2850/60 congestion and trendline from the November high. Meanwhile, support is raised to the 1.2750 congestion which should now underpin and sustain strong bounce from the 1.2650, 7 May low.