Published: 2026-04-24T02:25:27.000Z
Chart USD/SGD Update: Extending corrective bounce
2
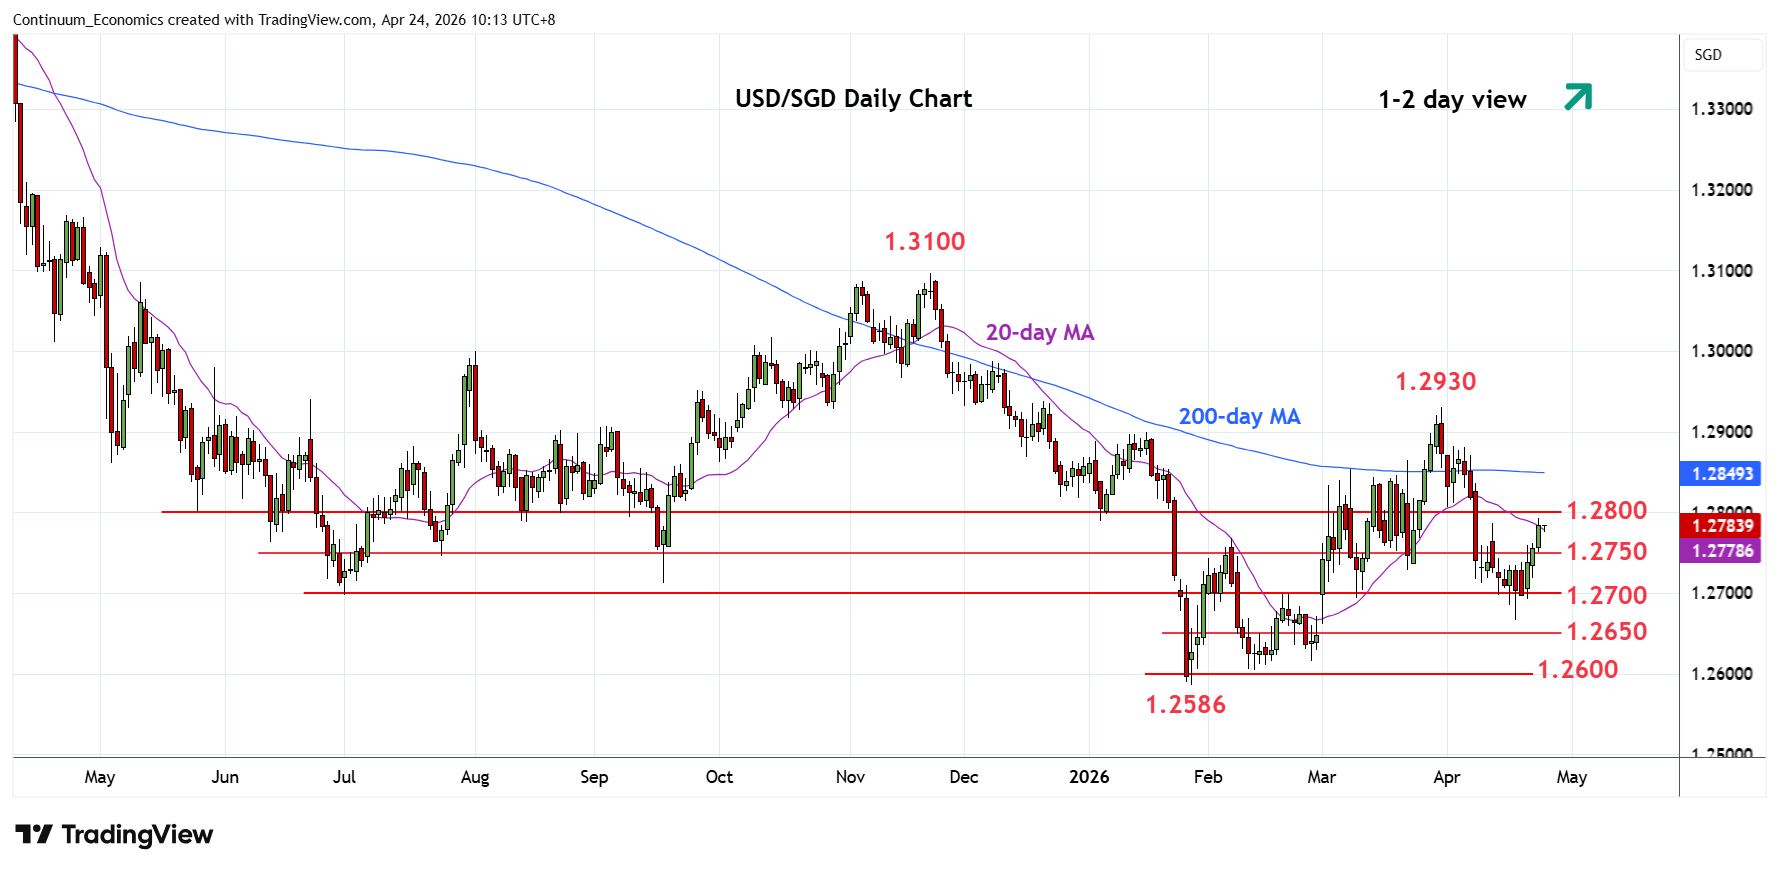
Extending bounce from the 1.2667 low of last week as prices retrace losses from the 1.2930 March current year high
| Level | Comment | Level | Comment | ||||
|---|---|---|---|---|---|---|---|
| R4 | 1.2930 | ** | 31 Mar YTD high | S1 | 1.2750 | * | congestion |
| R3 | 1.2900 | * | Jan high | S2 | 1.2700 | ** | 19 Feb high, 2025 yr low |
| R2 | 1.2850 | * | congestion | S3 | 1.2667 | * | 17 Apr low |
| R1 | 1.2800/07 | ** | congestion, 1 Apr low | S4 | 1.2650 | congestion |
Asterisk denotes strength of level
02:20 GMT - Extending bounce from the 1.2667 low of last week as prices retrace losses from the 1.2930 March current year high to approach the 1.2800/07 resistance which is expected to cap. Corrective gains are expected to give way to renewed selling pressure later with support raised to 1.2750. Below this will return focus to the downside for retest of the 1.2700 level and 1.2667 low. Below this will see room to the 1.2650/1.2600 congestion area and the 1.2586 January current year low and see room to extend the broader losses from the 2020 year high.