Published: 2026-01-08T12:14:57.000Z
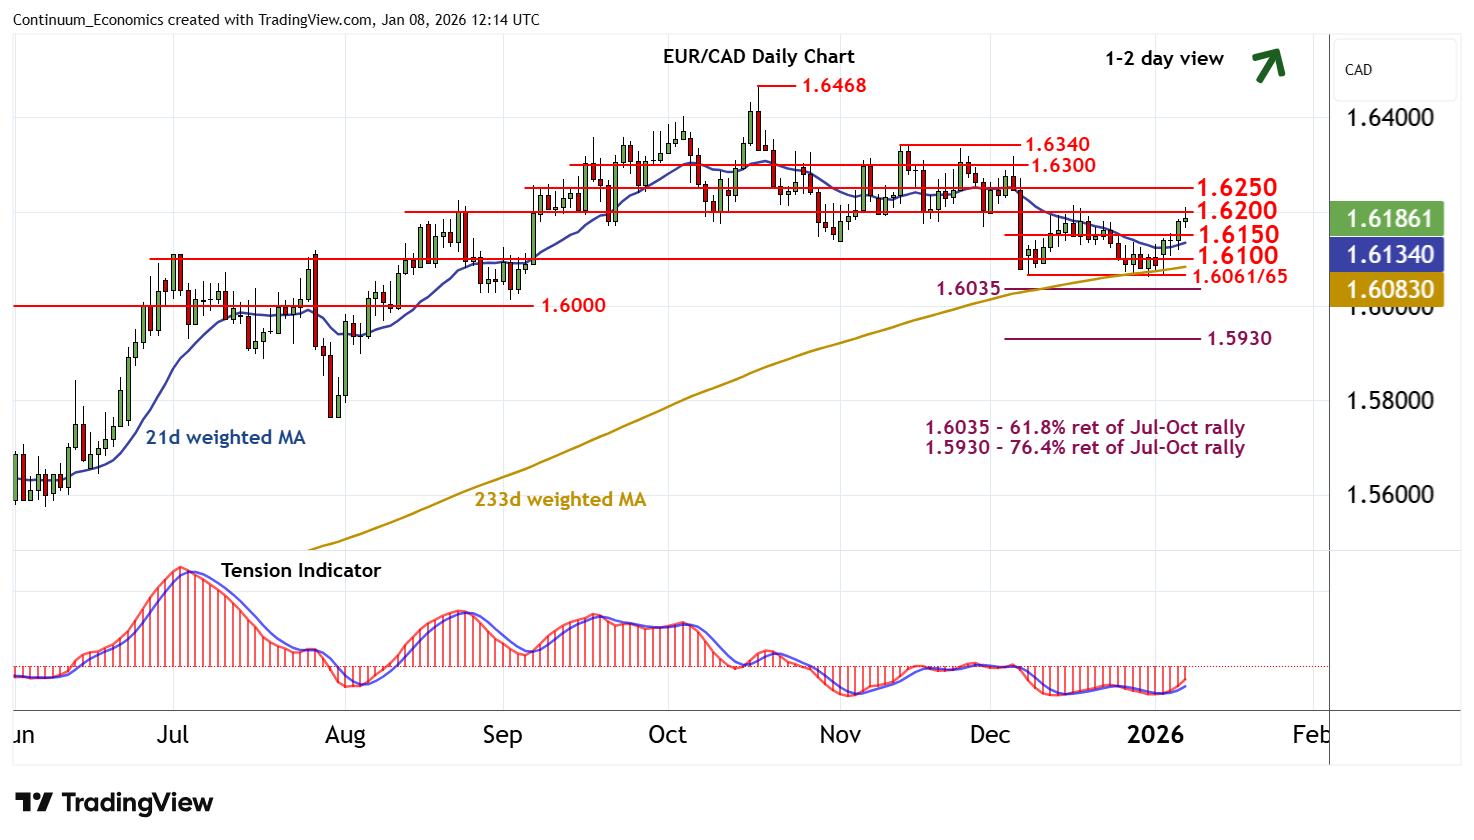
Chart EUR/CAD Update: Room for a test above 1.6200
1
The anticipated break above 1.6150 has reached congestion resistance at 1.6200
| Level | Comment | Level | Comment | |||||
|---|---|---|---|---|---|---|---|---|
| R4 | 1.6340 | ** | 13 Nov (m) high | S1 | 1.6150 | * | congestion | |
| R3 | 1.6300 | * | congestion | S2 | 1.6100 | * | congestion | |
| R2 | 1.6250 | break level | S3 | 1.6061/65 | * | 8-31 Dec (m) lows | ||
| R1 | 1.6200 | * | congestion | S4 | 1.6035 | ** | 61.8% ret of Jul-Oct rally |
Asterisk denotes strength
12:00 GMT - The anticipated break above 1.6150 has reached congestion resistance at 1.6200, where unwinding overbought intraday studies are prompting short-term reactions. Daily readings are rising and oversold weekly stochastics are flat, suggesting room for a fresh test above here. But the negative weekly Tension Indicator and bearish longer-term charts should limit scope in renewed selling interest towards resistance at 1.6250. Meanwhile, support is raised to congestion around 1.6150 and extends to further congestion around 1.6100. This range should underpin any immediate setbacks.