Published: 2025-12-15T06:08:24.000Z
Chart USD/MYR Update: Prices remain under pressure
1
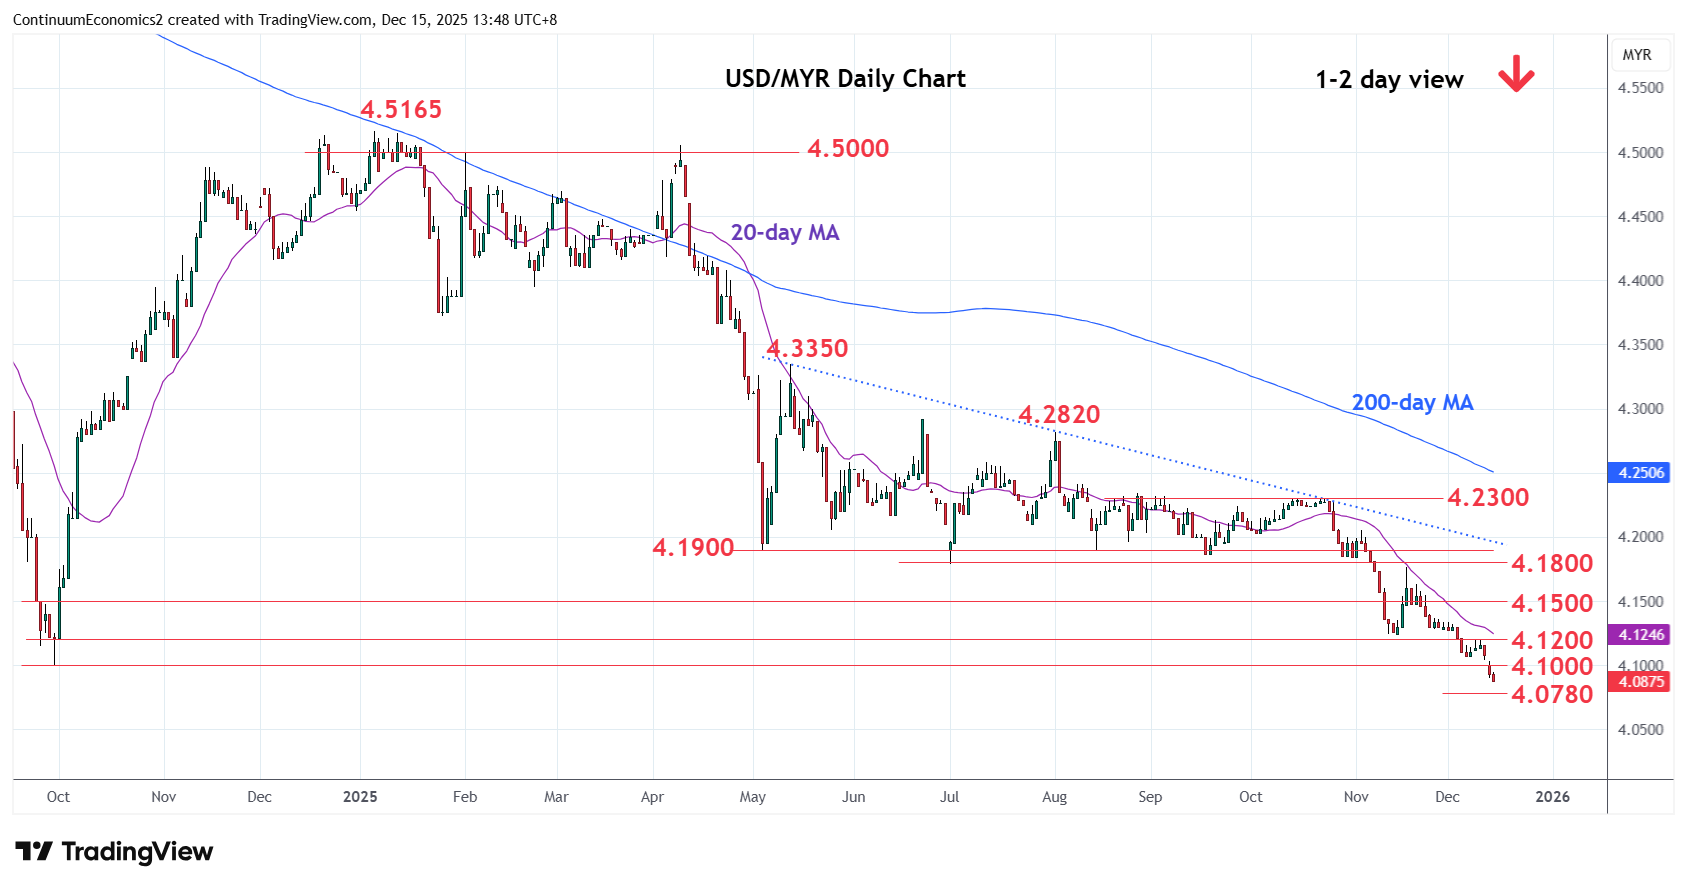
Extending losses and break of the 4.1000 level see prices reaching fresh year low to support at the 4.0900/4.0800 congestion area
| Levels | Imp | Comment | Levels | Imp | Comment | |||
|---|---|---|---|---|---|---|---|---|
| R4 | 4.1800 | ** | Jul low | S1 | 4.0780 | * | 76.4% 2018/2024 rally | |
| R3 | 4.1470/00 | * | 18 Nov low, congestion | S2 | 4.0650 | Nov 2020 low | ||
| R2 | 4.1240 | ** | 14 Nov low | S3 | 4.0500 | * | congestion | |
| R1 | 4.1060 | * | 5 Dec low | S4 | 4.0280 | * | Feb 2021 low |
Asterisk denotes strength of level
06:00 GMT - Extending losses and break of the 4.1000 level see prices reaching fresh year low to support at the 4.0900/4.0800 congestion area. Lower will see room to the 4.0780, 76.4% Fibonacci level, and the 4.0650/4.0500 congestion with deep oversold daily and weekly studies showing no signs of unwinding. Meanwhile, resistance remains at the 4.1060/4.1240 recent lows. Would need lift over these to ease the downside pressure and open up room for corrective bounce to retrace losses from the 4.2300, October high.