Published: 2026-03-27T02:22:33.000Z
Chart USD/SGD Update: Extending gains
1
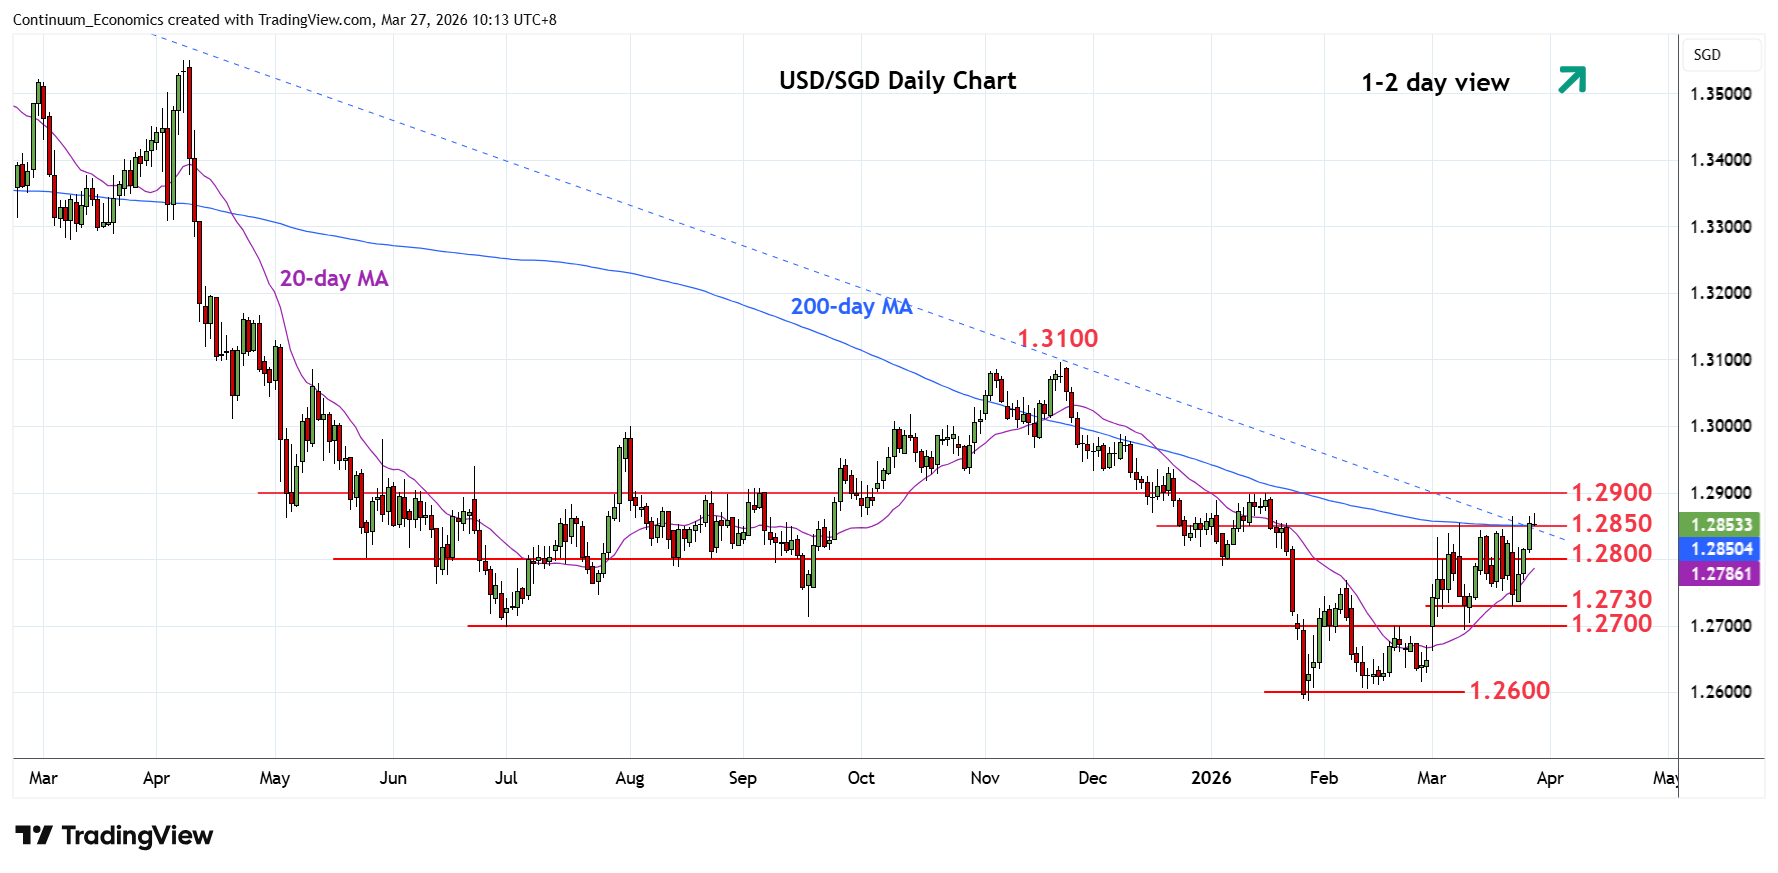
Extending bounce from the 1.2730 low to retest strong resistance at the 1.2850/65, 200-day MA and 23 March high
| Level | Comment | Level | Comment | ||||
|---|---|---|---|---|---|---|---|
| R4 | 1.2950 | * | congestion | S1 | 1.2800 | * | congestion |
| R3 | 1.2938 | 19 Dec high | S2 | 1.2730 | * | 23 Mar low | |
| R2 | 1.2900 | ** | 16 Jan YTD high, 61.8% | S3 | 1.2700 | ** | 19 Feb high, 2025 yr low |
| R1 | 1.2850/65 | ** | 200-day MA, 23 Mar high | S4 | 1.2650 | congestion |
Asterisk denotes strength of level
02:20 GMT - Extending bounce from the 1.2730 low to retest strong resistance at the 1.2850/65, 200-day MA and 23 March high. Positive daily studies suggest scope for break here to further retrace losses from the November high and see extension to the 1.2900 January YTD high and 61.8% Fibonacci retracement. Higher still, will see room to the 1.2938/50 congestion area. Meanwhile, support remains at the 1.2800 level which should now underpin and sustain gains from support at the 1.2730/1.2700 higher lows.