Published: 2025-12-03T06:10:44.000Z
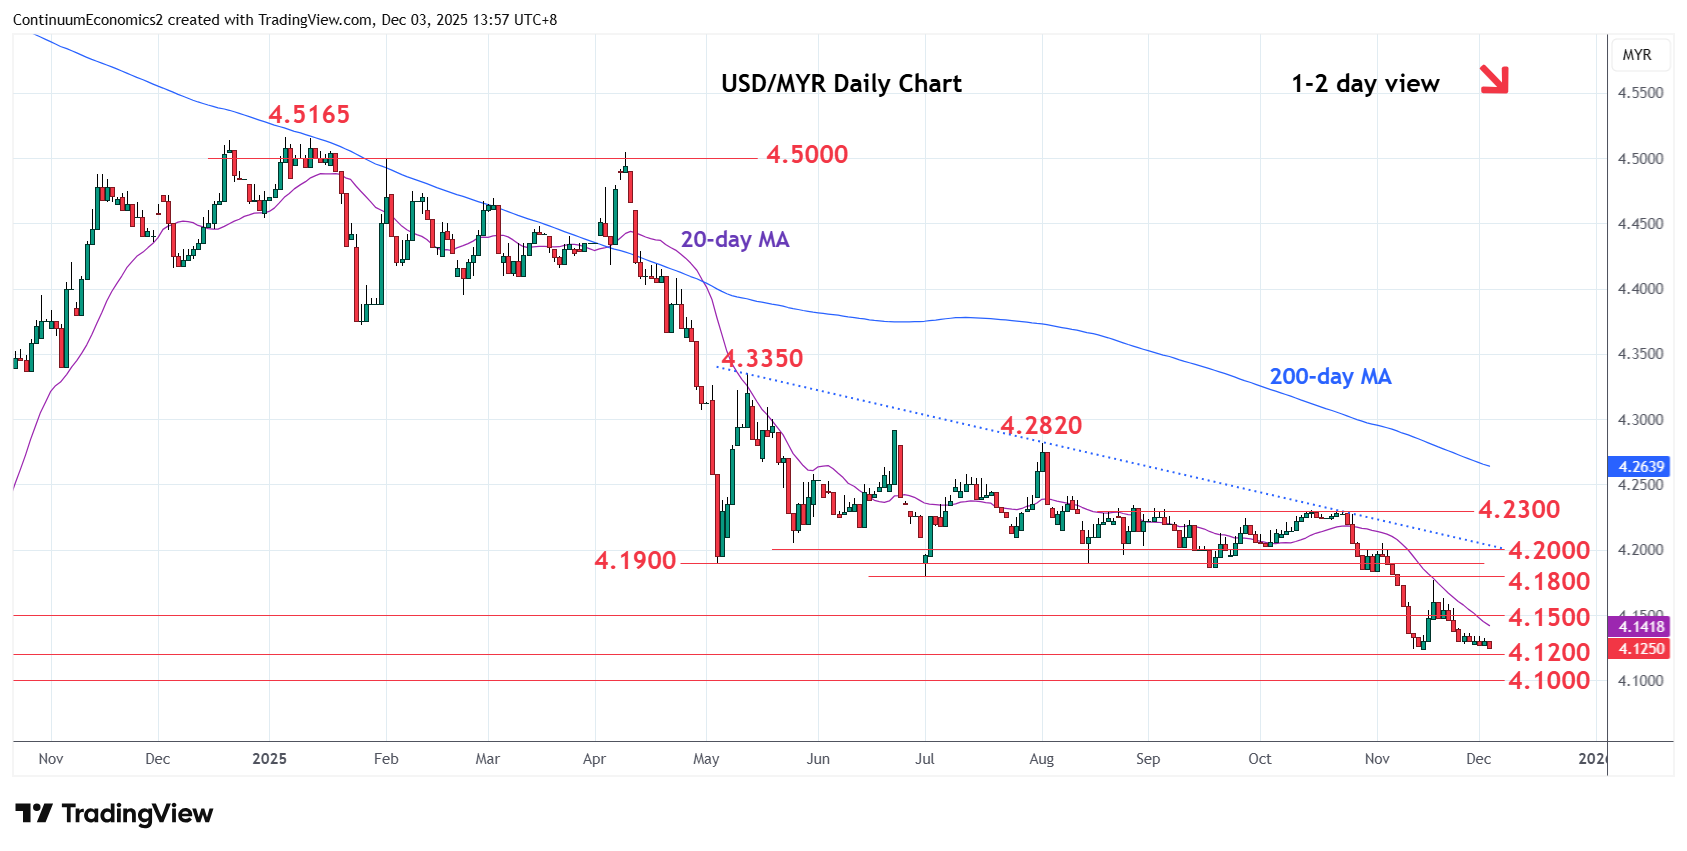
Chart USD/MYR Update: Poised for retest of 4.1240, November current year low
-
Extend consolidation above the 4.1240 November current year low but pressure building on the downside
| Levels | Imp | Comment | Levels | Imp | Comment | |||
|---|---|---|---|---|---|---|---|---|
| R4 | 4.2000 | * | congestion | S1 | 4.1240 | ** | 14 Nov YTD low | |
| R3 | 4.1900 | ** | May low | S2 | 4.1200 | * | congestion | |
| R2 | 4.1800 | ** | Jul low | S3 | 4.1000 | ** | Sep 2024 year low | |
| R1 | 4.1470/00 | * | 18 Nov low, congestion | S4 | 4.0900 | * | Apr 2021 low |
Asterisk denotes strength of level
06:05 GMT - Extend consolidation above the 4.1240 November current year low but pressure building on the downside. Daily and weekly studies have stretched into oversold areas and caution corrective bounce following sharp losses from the 4.2300, October high. Break of the 4.1240 low and 4.1200 level, if seen, will turn focus to the 4.1000 level and September 2024 year low. Meanwhile, resistance is at the 4.1470/4.1500 congestion area which is expected to cap. Only above here will ease the downside pressure and see room for stronger corrective bounce.