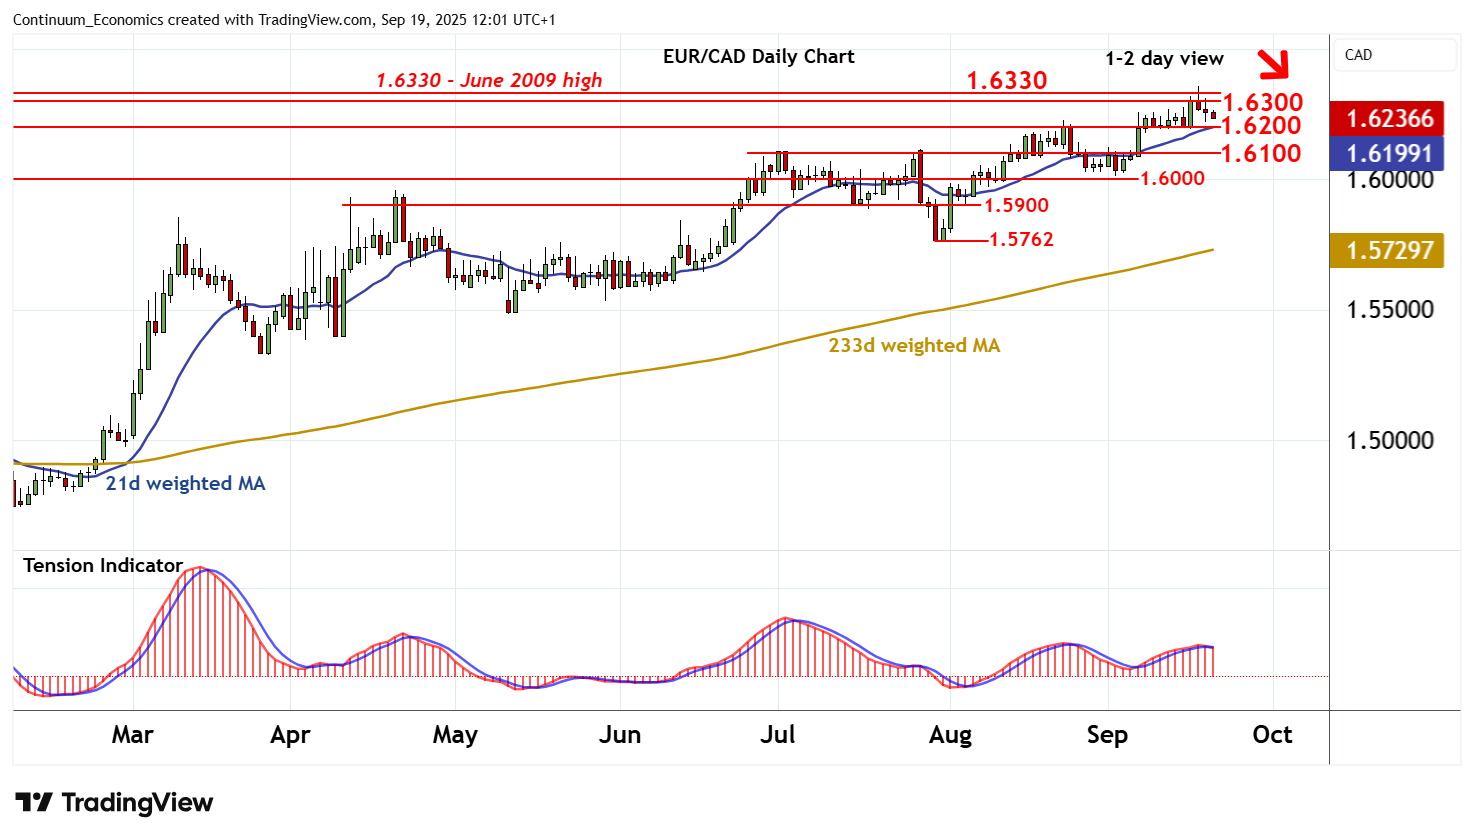
Chart EUR/CAD Update: Drifting lower
Little change, as prices drift lower from the 1.6360~ spike year high of 17 September towards congestion support at 1.6200
| Level | Comment | Level | Comment | |||||
|---|---|---|---|---|---|---|---|---|
| R4 | 1.6400 | * | historic congestion | S1 | 1.6200 | * | congestion | |
| R3 | 1.6360 | ** | 17 Sep YTD high | S2 | 1.6100 | ** | congestion | |
| R2 | 1.6330 | ** | June 2009 high | S3 | 1.6000 | ** | congestion | |
| R1 | 1.6300 | * | historic congestion | S4 | 1.5900 | congestion |
Asterisk denotes strength
11:45 BST - Little change, as prices drift lower from the 1.6360~ spike year high of 17 September towards congestion support at 1.6200. Overbought daily stochastics are unwinding and the daily Tension Indicator is also turning bearish, highlighting a deterioration in sentiment and room for a break beneath here towards further congestion around 1.6100. However, broader weekly charts are mixed/positive, suggesting any initial tests could give way to fresh consolidation. Meanwhile, resistance is at congestion around 1.6300 and extends to the 1.6330 high of June 2009. But a close above 1.6360~ is needed to turn sentiment positive once again and open up historic congestion around 1.6400.