Chart USD/MXN Update: Choppy trade - studies improving
The sharp break higher to strong resistance within the 17.9330 - 18.0000 range is giving way to choppy trade
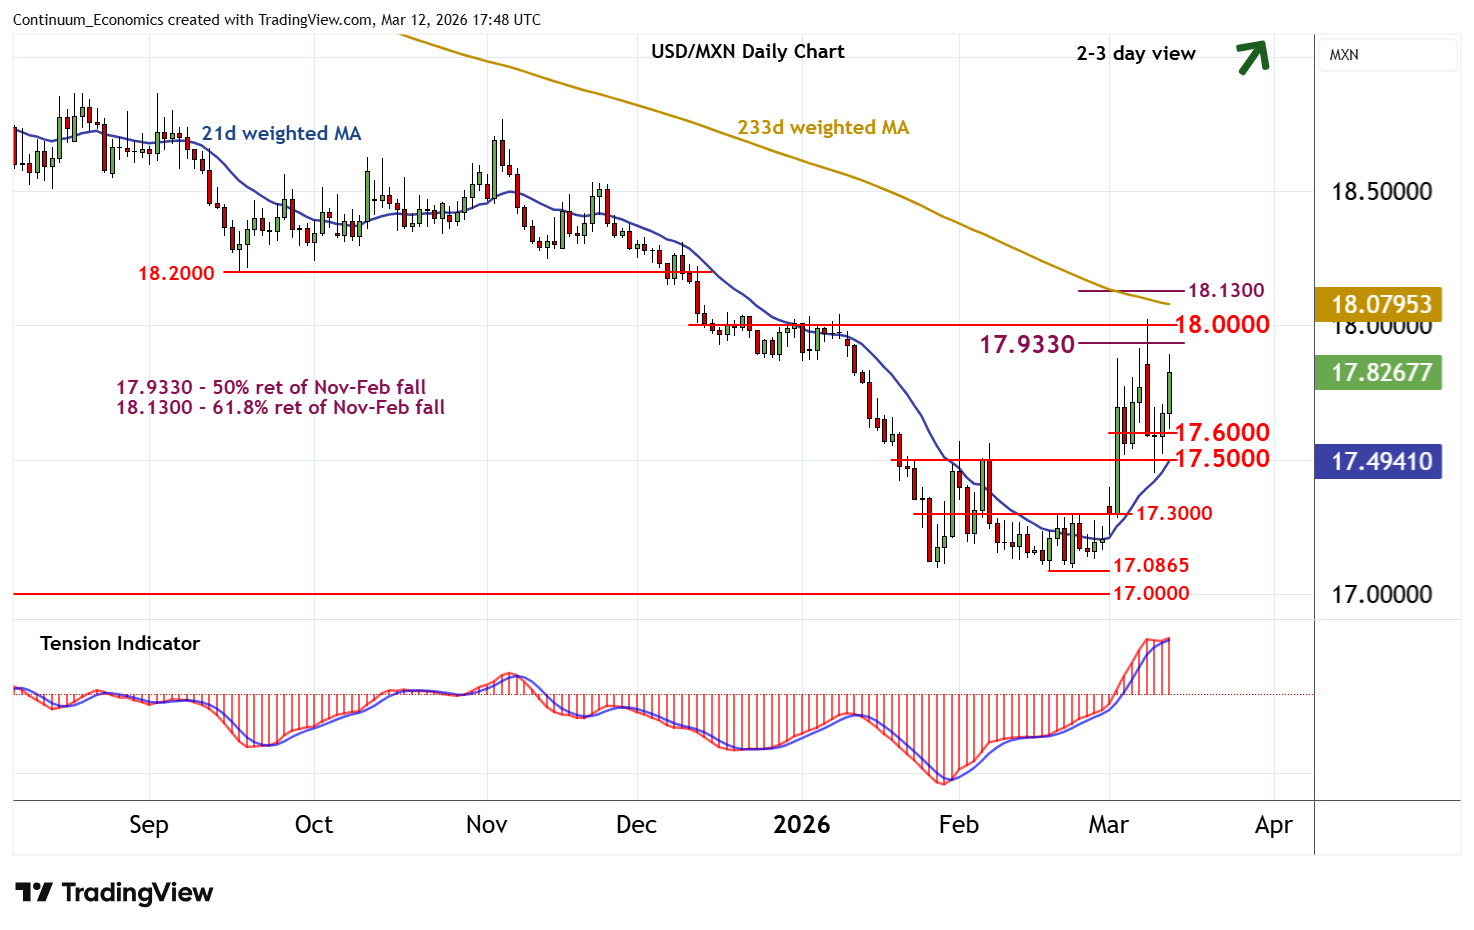
| Levels | Imp | Comment | Levels | Imp | Comment | |||
|---|---|---|---|---|---|---|---|---|
| R4 | 18.2000 | ** | congestion | S1 | 17.6000 | ** | congestion | |
| R3 | 18.1300 | ** | 61.8% ret of Nov-Feb fall | S2 | 17.5000 | ** | congestion | |
| R2 | 18.0000 | ** | break level | S3 | 17.3000 | * | break level | |
| R1 | 17.9330 | * | 50% ret of Nov-Feb fall | S4 | 17.0865 | ** | 18 Feb YTD low |
Asterisk denotes strength of level
17:05 GMT - The sharp break higher to strong resistance within the 17.9330 - 18.0000 range is giving way to choppy trade, with prices currently balanced around 17.8180. Flat daily readings have ticked higher once again and broader weekly charts are positive, highlighting room for further strength in the coming sessions. However, a close above the 17.9330 Fibonacci retracement is needed to turn sentiment positive and extend February gains beyond 18.0000 towards the 18.1300 retracement. Meanwhile, support is at congestion around 17.6000 and extends to 17.5000. A close beneath here, if seen, will turn sentiment neutral and prompt consolidation above 17.3000.