Published: 2026-03-24T05:35:12.000Z
Chart USD/INR Update: Consolidating below 93.9800 all-time high
1
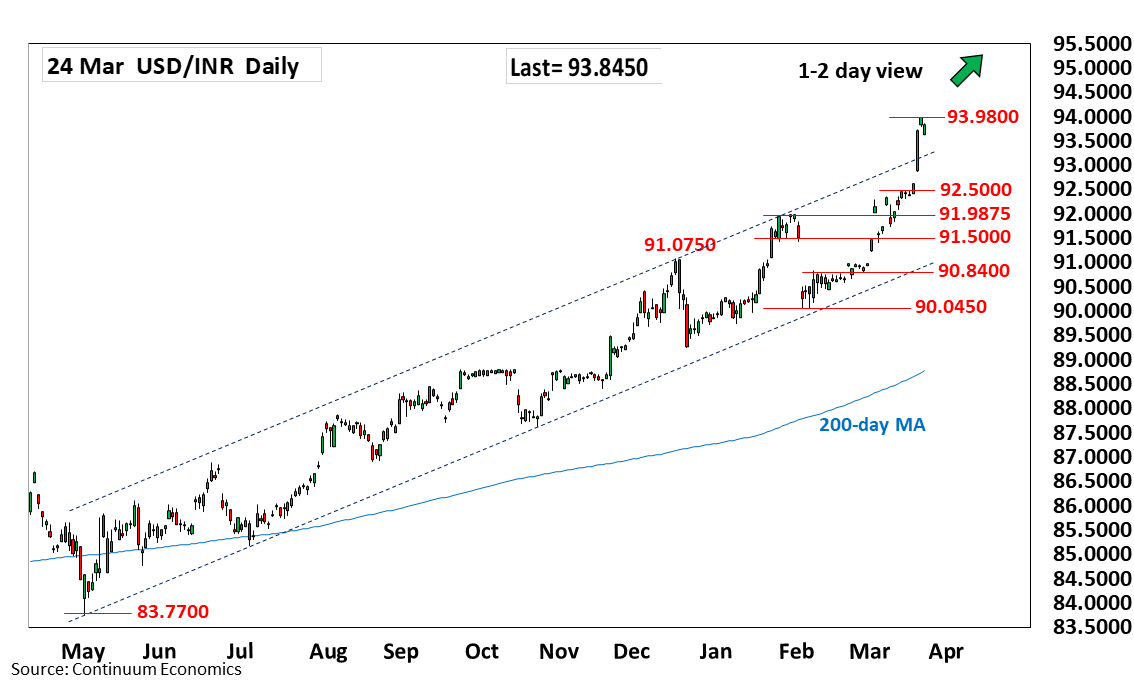
Settled back from fresh record high at 93.9800 as prices consolidate the sharp break above the 92.4750/92.5000 resistance
| Level | Comment | Level | Comment | |||||
|---|---|---|---|---|---|---|---|---|
| R4 | 95.0000 | * | figure | S1 | 93.0000 | figure | ||
| R3 | 94.9900 | * | projection | S2 | 92.8800 | * | 20 Mar low | |
| R2 | 94.5000 | * | projection | S3 | 92.5000 | * | congestion | |
| R1 | 93.9800 | ** | 23 Mar all-time high | S4 | 92.4750 | * | 13 Mar high |
Asterisk denotes strength of level
05:30 GMT - Settled back from fresh record high at 93.9800 as prices consolidate the sharp break above the 92.4750/92.5000 resistance. Pullback see prices unwinding the overbought daily studies to support at the 93.0000/92.8800 congestion and 20 March low which should underpin. Break here will open up room for deeper pullback to 92.5000/92.4750 area. Meanwhile, resistance at 93.9800 high now expected to cap. Clearance here will see scope to target the 94.0000 figure and further extend gains to the 94.5000 projection objective.