Published: 2025-12-10T06:20:04.000Z
Chart USD/IDR Updates: Consolidating above 16600 support
2
Turned up in consolidation from the 16625 low of last week as prices unwind oversold daily studies
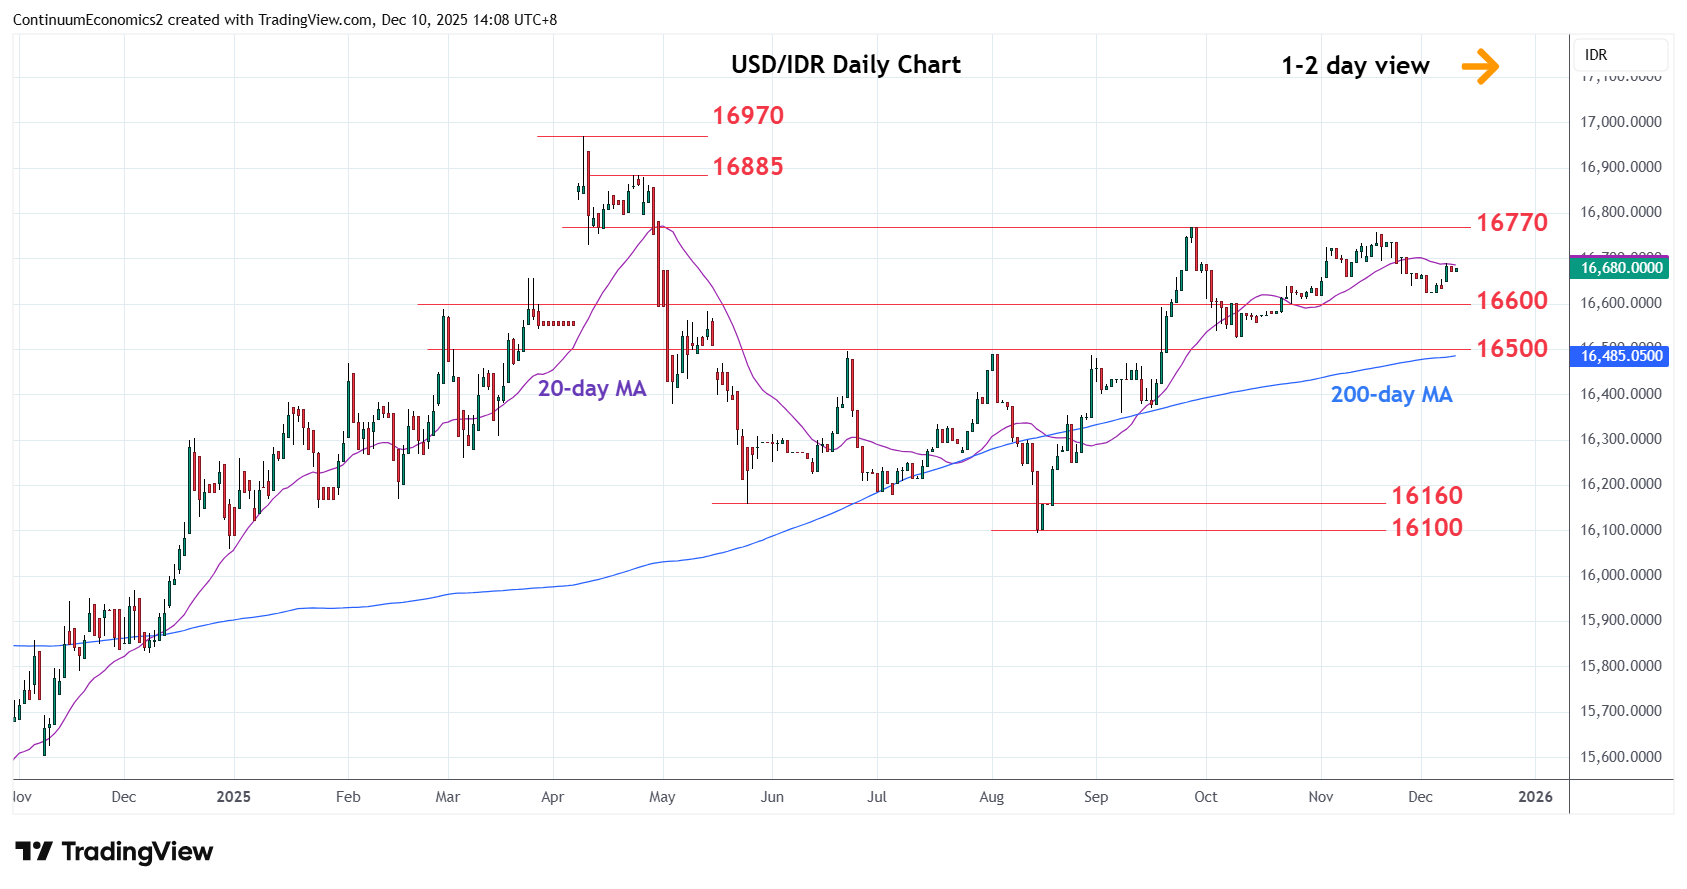
| Levels | Imp | Comment | Levels | Imp | Comment | |||
|---|---|---|---|---|---|---|---|---|
| R4 | 16885 | * | 23 Apr high | S1 | 16600 | * | congestion | |
| R3 | 16800 | * | congestion | S2 | 16525 | * | Oct low | |
| R2 | 16770/60 | ** | Sep, Nov highs | S3 | 16500 | ** | Jun high, congestion | |
| R1 | 16700 | * | congestion | S4 | 16400 | * | congestion |
Asterisk denotes strength of level
06:15 GMT - Turned up in consolidation from the 16625 low of last week as prices unwind oversold daily studies. Bounce see resistance starting at the 16700 congestion. Above here will expose the 16760 and 16770, November/September highs to retest. Would expect these highs to cap and give way to fresh selling pressure later. Below the 16625 support and the 16600 level will see room for retest of strong support at 16525/16500, congestion and June high. Break of the latter will see deeper pullback to retrace August/September rally to the 16400 congestion.