Published: 2025-10-03T04:16:30.000Z
Chart USD/IDR Updates: Weighing on 16600 support
1
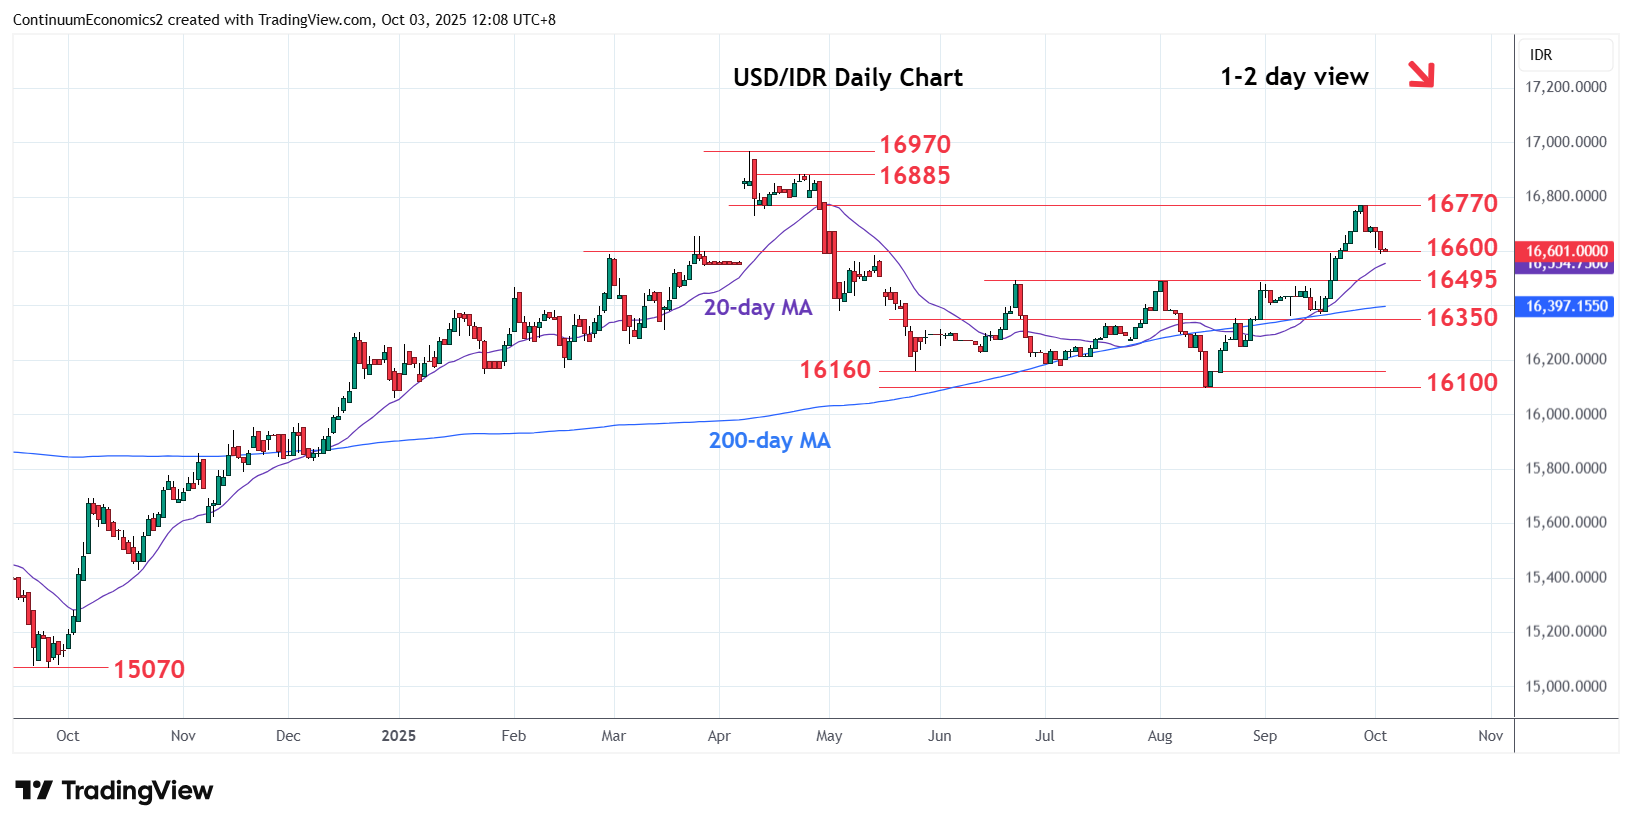
Extending pullback from the 16770 high to pressure support at the 16600 congestion
| Levels | Imp | Comment | Levels | Imp | Comment | |||
|---|---|---|---|---|---|---|---|---|
| R4 | 16970 | ** | 9 Apr all-time high | S1 | 16600 | * | congestion | |
| R3 | 16885 | * | 24 Apr high | S2 | 16495 | ** | Jun high | |
| R2 | 16800 | * | congestion | S3 | 16350 | * | congestion | |
| R1 | 16770 | ** | 26 Sep high | S4 | 16250 | * | 25 Aug low |
Asterisk denotes strength of level
04:10 GMT - Extending pullback from the 16770 high to pressure support at the 16600 congestion as prices unwind overbought daily studies. Break here will see room for deeper pullback to retrace gains from the 16100 low of August to the strong support at the 16495, June-August range highs. Would take break here to fade the upside pressure and further retrace gains from the 16100 low. Meanwhile, resistance is lowered to 16700 level which is expected to cap and sustain pullback from the 16770 high.