Published: 2025-12-18T05:15:28.000Z
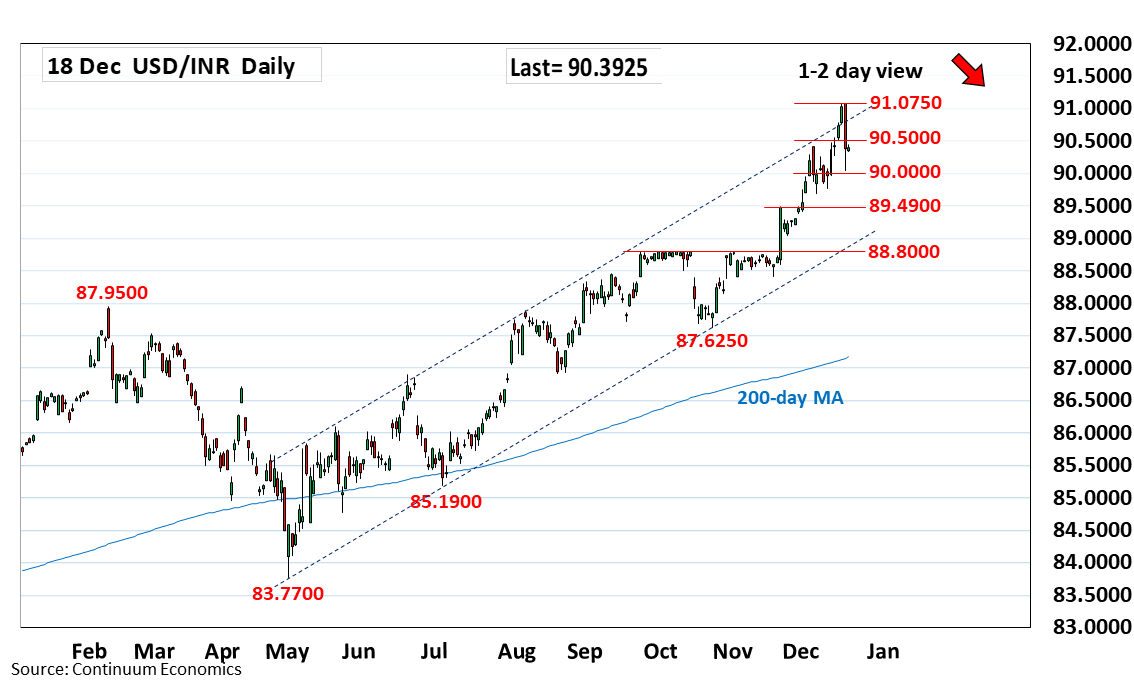
Chart USD/INR Update: Turned up in consolidation from 90.0500 low
-
Settled into consolidation after the sharp rejection from 91.0750 Tuesday's record high
| Level | Comment | Level | Comment | |||||
|---|---|---|---|---|---|---|---|---|
| R4 | 91.5800 | * | projection | S1 | 90.0000 | * | figure, congestion | |
| R3 | 91.5500 | * | projection | S2 | 89.6950 | * | 5 Dec low | |
| R2 | 91.0750 | ** | 16 Dec all-time high | S3 | 89.4900 | ** | Nov high | |
| R1 | 90.5000 | * | congestion | S4 | 89.0000 | * | figure |
Asterisk denotes strength of level
05:00 GMT - Settled into consolidation after the sharp rejection from 91.0750 Tuesday's record high as prices unwind deep overbought daily studies. Consolidation see resistance lowered to the 90.5000 congestion which is expected to cap and sustain reversal from the 91.0750 high. Weekly studies are stretched as well and highlights potential for break of 90.0000 level to open up room for deeper retracement of gains from the 87.6250, October low. Lower will see room to 89.6950 then the strong support at 89.49000, November high.