Published: 2026-04-14T05:18:37.000Z
Chart USD/MYR Update: Under pressure
1
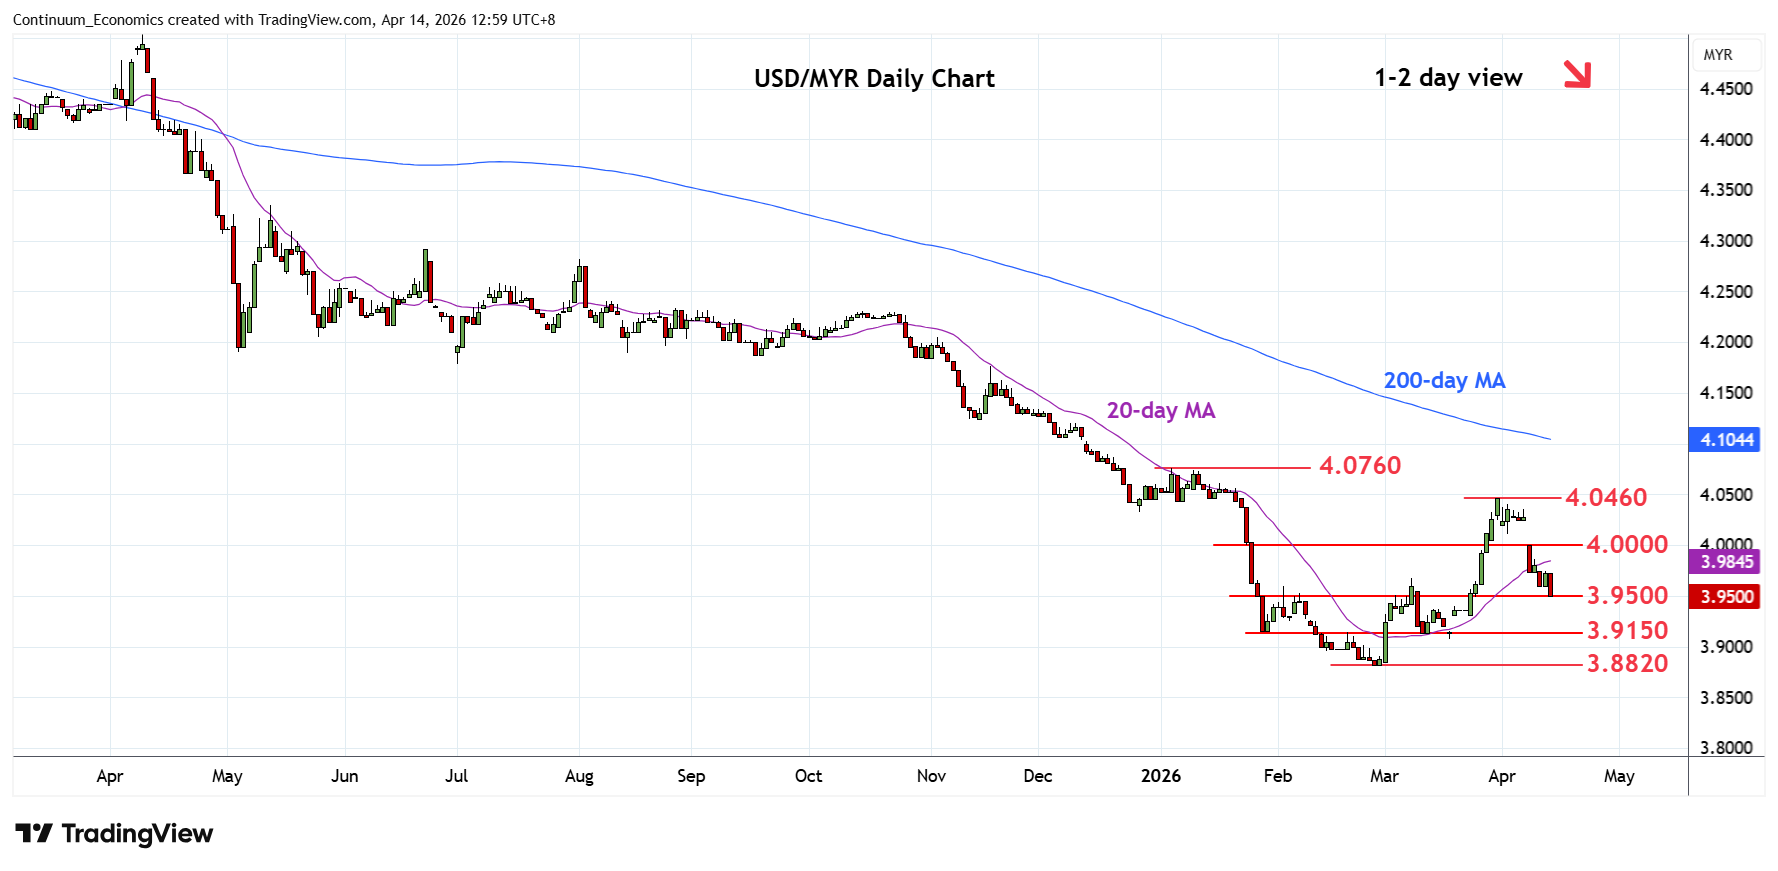
Under pressure as prices extend pullback from the 4.0460 high of 31st March to reach support at the 3.9500 congestion
| Levels | Imp | Comment | Levels | Imp | Comment | |||
|---|---|---|---|---|---|---|---|---|
| R4 | 4.0560 | * | 50% Oct/Feb fall | S1 | 3.9500 | * | congestion | |
| R3 | 4.0460 | ** | 31 Mar high | S2 | 3.9300 | * | congestion | |
| R2 | 4.0100 | * | 2 Apr low | S3 | 3.9150 | * | Jan low, congestion | |
| R1 | 4.0000 | * | congestion | S4 | 3.8820 | ** | 26 Feb YTD low |
Asterisk denotes strength of level
05:10 GMT - Under pressure as prices extend pullback from the 4.0460 high of 31st March to reach support at the 3.9500 congestion. Negative daily and weekly studies highlight scope for break here extend losses to lower support at the 3.9300 congestion and 3.9150, January low. Below this will return focus to the 3.8820 February current year low. Meanwhile, resistance is lowered to the 3.9750 congestion and extending to the 4.0000 figure. This area is now expected to cap and sustain rejection from the 4.0460 late-March swing high.