Published: 2026-03-05T05:30:38.000Z
Chart USD/IDR Updates: Consolidating
1
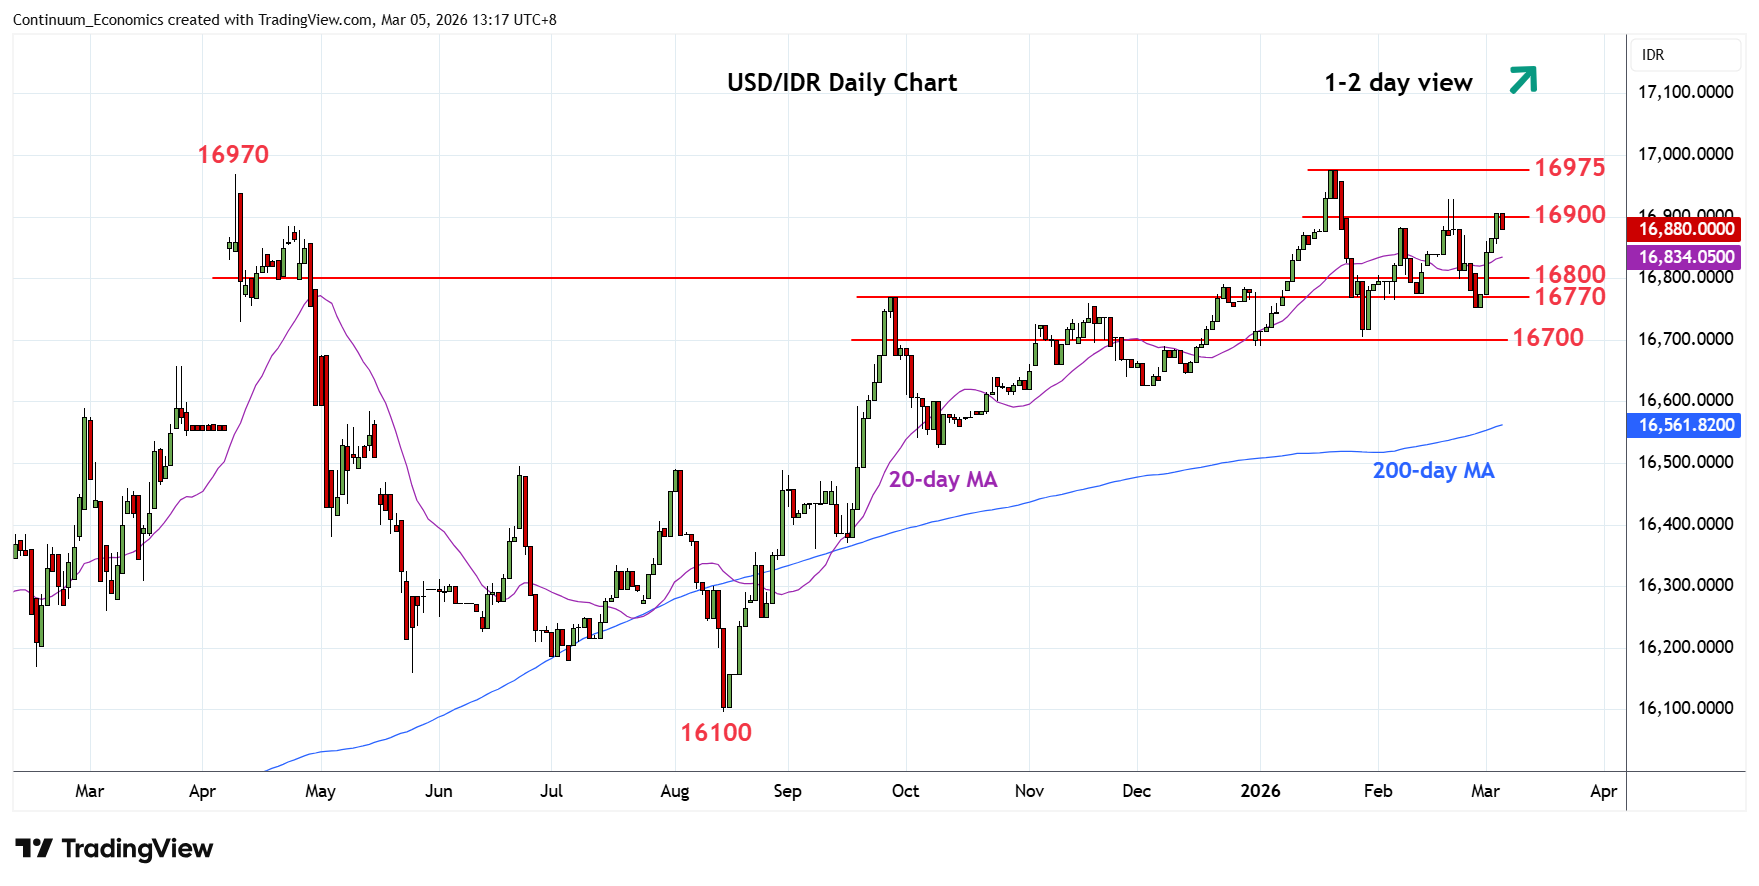
Settled back from the 16906 high as prices consolidate strong gains from the 16755, February low
| Levels | Imp | Comment | Levels | Imp | Comment | |||
|---|---|---|---|---|---|---|---|---|
| R4 | 17000 | ** | figure | S1 | 16855 | 4 Mar low | ||
| R3 | 16975 | ** | 20 Jan all-time high | S2 | 16800 | * | congestion | |
| R2 | 16930 | * | Feb high | S3 | 16755 | ** | Feb low | |
| R1 | 16906 | * | 4 Mar high | S4 | 16705 | ** | 28 Jan YTD low |
Asterisk denotes strength of level
05:25 GMT - Settled back from the 16906 high as prices consolidate strong gains from the 16755, February low. Daily studies are tracking higher and further gains cannot be ruled out to retest the 16930, February high. Break here will return focus to the 16975, January all-time high. Meanwhile, support at the 16855/16800 area should underpin. Failure here will expose critical support at 16755 and 16705 lows to retest. Would take break of these to fade the upside pressure and see room for deeper correction of gains from the August low.