Published: 2026-04-29T06:11:41.000Z
Chart USD/IDR Updates: Break to fresh historic high
3
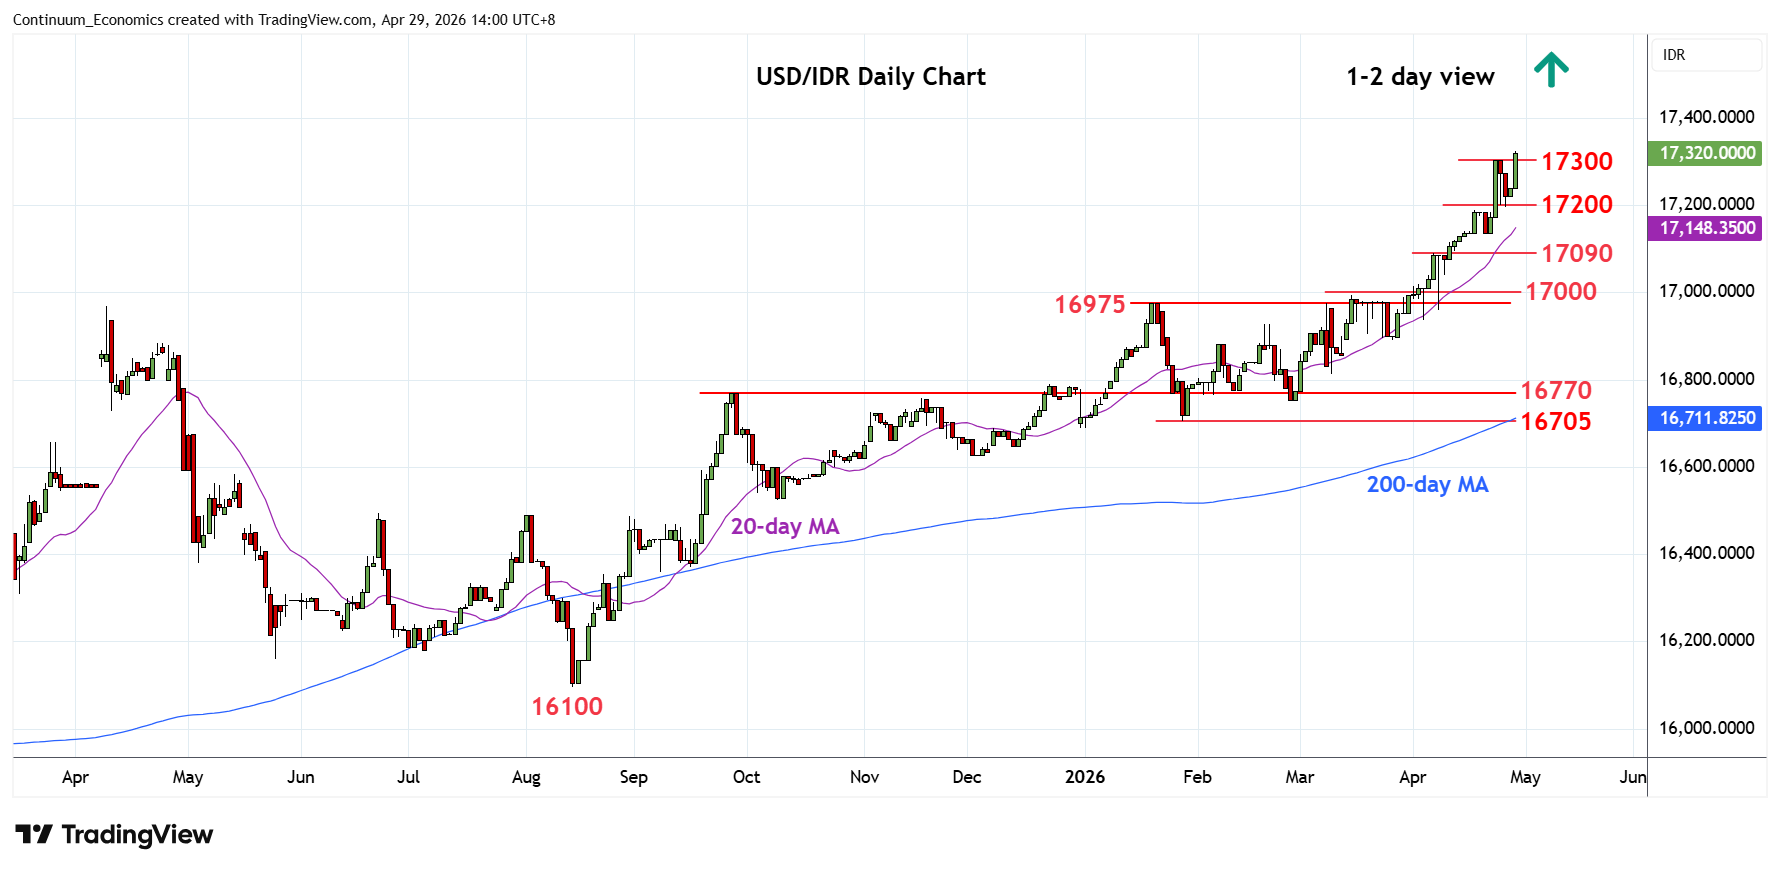
Consolidation below the 17300 high has given way to break to extend gains from the 16705 January low
| Levels | Imp | Comment | Levels | Imp | Comment | |||
|---|---|---|---|---|---|---|---|---|
| R4 | 18000 | figure | S1 | 17200/190 | * | congestion, 17 Apr high | ||
| R3 | 17600 | projection | S2 | 17137 | 17 Apr low | |||
| R2 | 17500 | projection | S3 | 17100/090 | ** | congestion, 7 Apr high | ||
| R1 | 17325 | intraday high | S4 | 17000 | ** | congestion |
Asterisk denotes strength of level
06:00 GMT - Consolidation below the 17300 high has given way to break to extend gains from the 16705 January low. Higher will see room for extension to the 17500 and 17600 projection targets. Higher still, if seen, will see room to the 18000 figure. However, deep overbought daily and weekly studies caution corrective pullback. Meanwhile, support remains at the 17200/17190 congestion and 17 April high. Break here will open up room for deeper correction of gains from the 16705 January current year low to support at 17 April low at 17137 then the 17100/17090 congestion area.