Published: 2026-03-25T02:18:57.000Z
Chart USD/SGD Update: Leaning lower from 1.2850 resistance
1
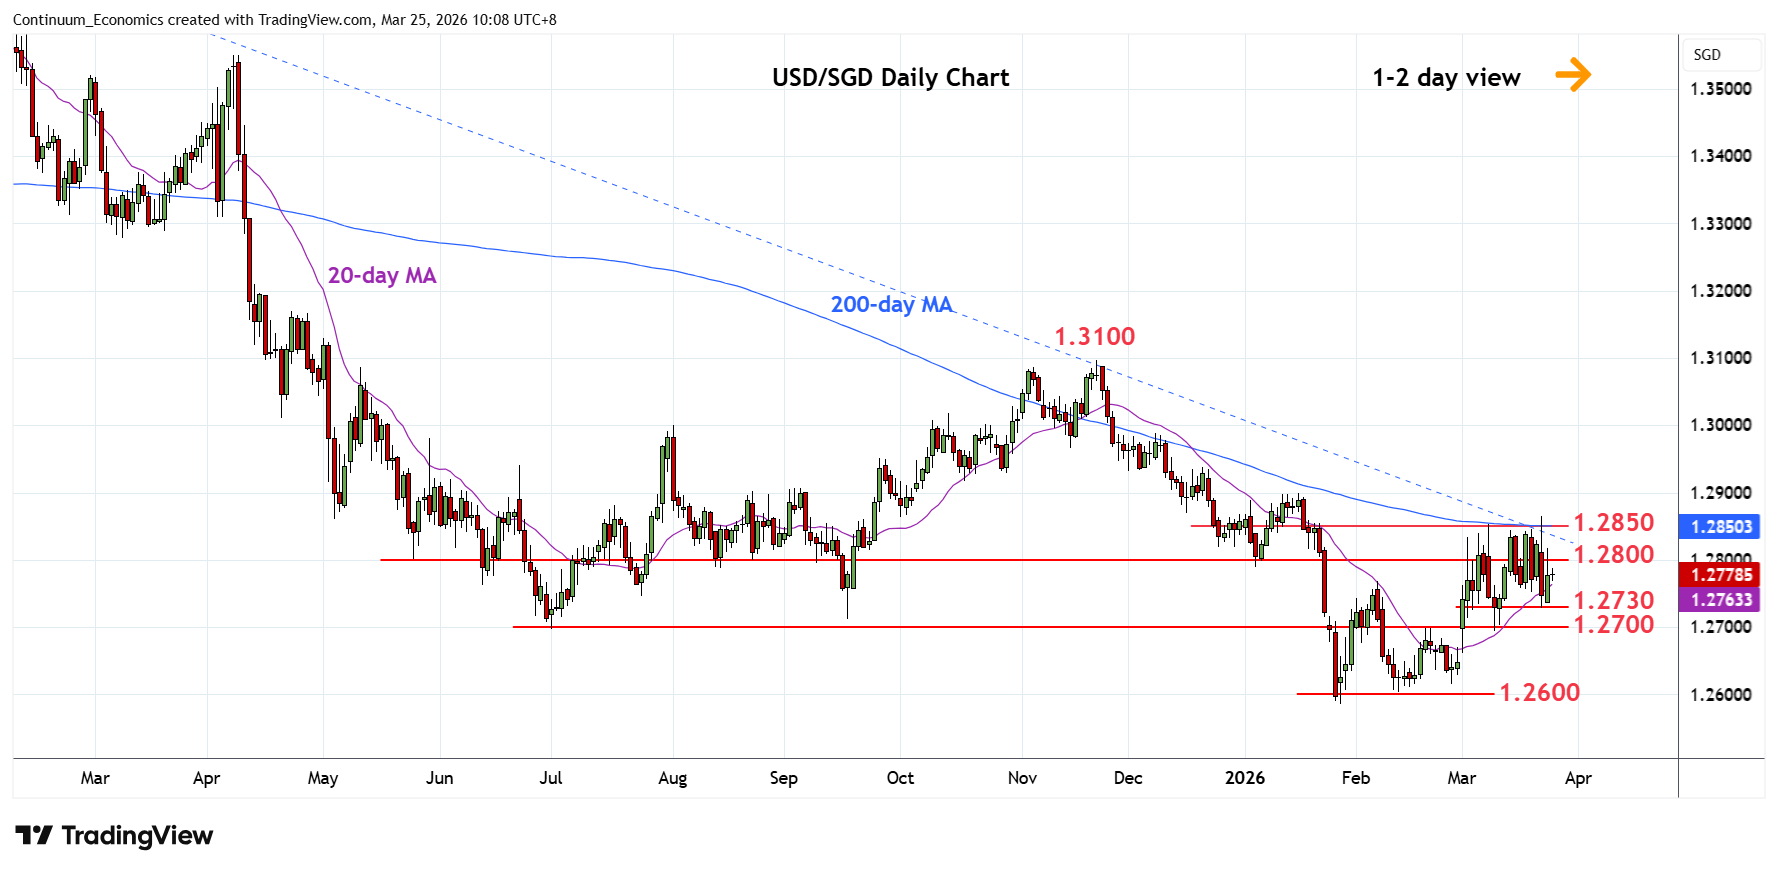
Choppy trade see consolidation leaning lower from the 1.2850 resistance to reach 1.2730 low
| Level | Comment | Level | Comment | ||||
|---|---|---|---|---|---|---|---|
| R4 | 1.2938 | 19 Dec high | S1 | 1.2730 | * | 23 Mar low | |
| R3 | 1.2900 | ** | 16 Jan YTD high, 61.8% | S2 | 1.2700 | ** | 19 Feb high, 2025 yr low |
| R2 | 1.2850/65 | ** | 200-day MA, 23 Mar high | S3 | 1.2650 | congestion | |
| R1 | 1.2800 | * | congestion | S4 | 1.2586 | ** | 28 Jan YTD low |
Asterisk denotes strength of level
02:10 GMT - Choppy trade see consolidation leaning lower from the 1.2850 resistance to reach 1.2730 low. Daily studies are tracking lower and suggest scope for break here to open up room for extension to strong support at the 1.2700 level. Below this will return focus to the downside for retest of the 1.2600 level and 1.2586 low. Meanwhile, resistance at the 1.2800/1.2850 congestion and 200-day MA expected to cap. Would take break here, but not expected, to clear the way for stronger gains to retrace losses from the November high.