Published: 2026-02-23T05:13:20.000Z
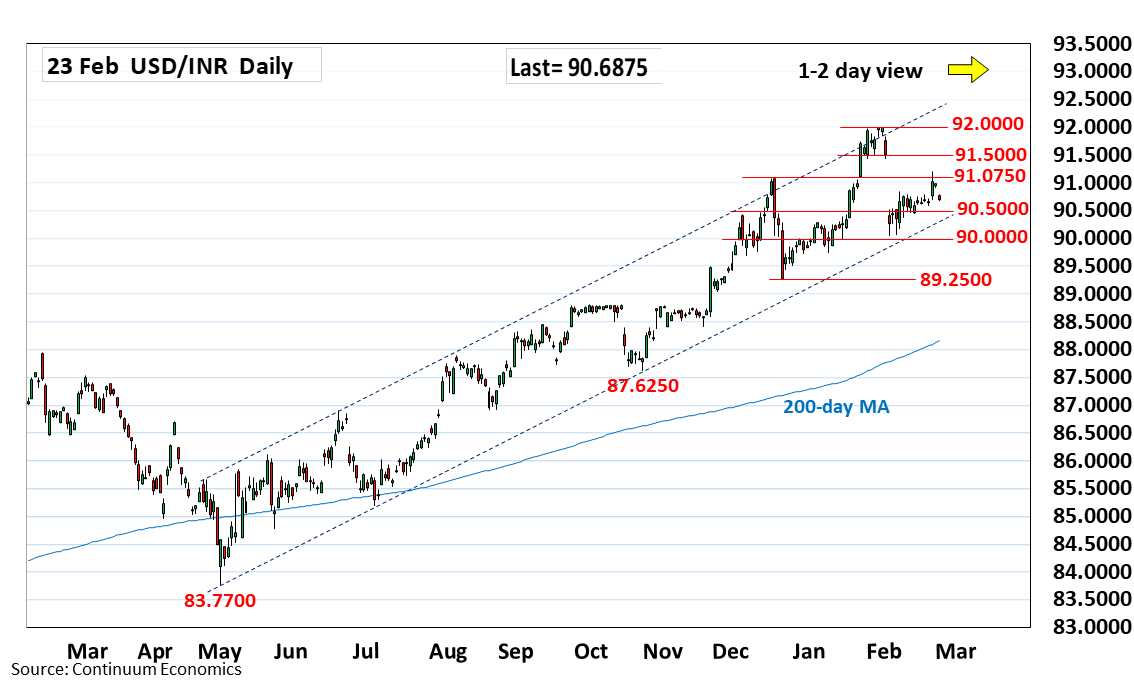
Chart USD/INR Update: Turned down from 91.2040 bounce high
-
Consolidation below the 91.2040 high has given way to pullback to retrace gains from the 90.0450, 3 February low
| Level | Comment | Level | Comment | |||||
|---|---|---|---|---|---|---|---|---|
| R4 | 92.1300 | * | extension | S1 | 90.5000 | * | congestion | |
| R3 | 91.9875 | ** | 30 Jan all-time high | S2 | 90.0450 | * | 3 Feb low | |
| R2 | 91.5000 | * | congestion | S3 | 89.7400 | * | Jan low | |
| R1 | 91.2040 | ** | 19 Feb high | S4 | 89.5000 | * | congestion |
Asterisk denotes strength of level
05:10 GMT - Consolidation below the 91.2040 high has given way to pullback to retrace gains from the 90.0450, 3 February low. Nearby see support at the 90.5000 congestion and break here will return focus to the 90.0450 low and the 90.0000 figure. Break here will extend the broader losses from the 91.9875 January all-time high and see room to support at 89.7400 January low and 89.5000 congestion. Meanwhile, resistance at the 91.2040 high of last week now expected to cap and sustain losses from the January high.