Published: 2025-10-28T05:41:46.000Z
Chart USD/IDR Updates: Settling back from 16640 high
3
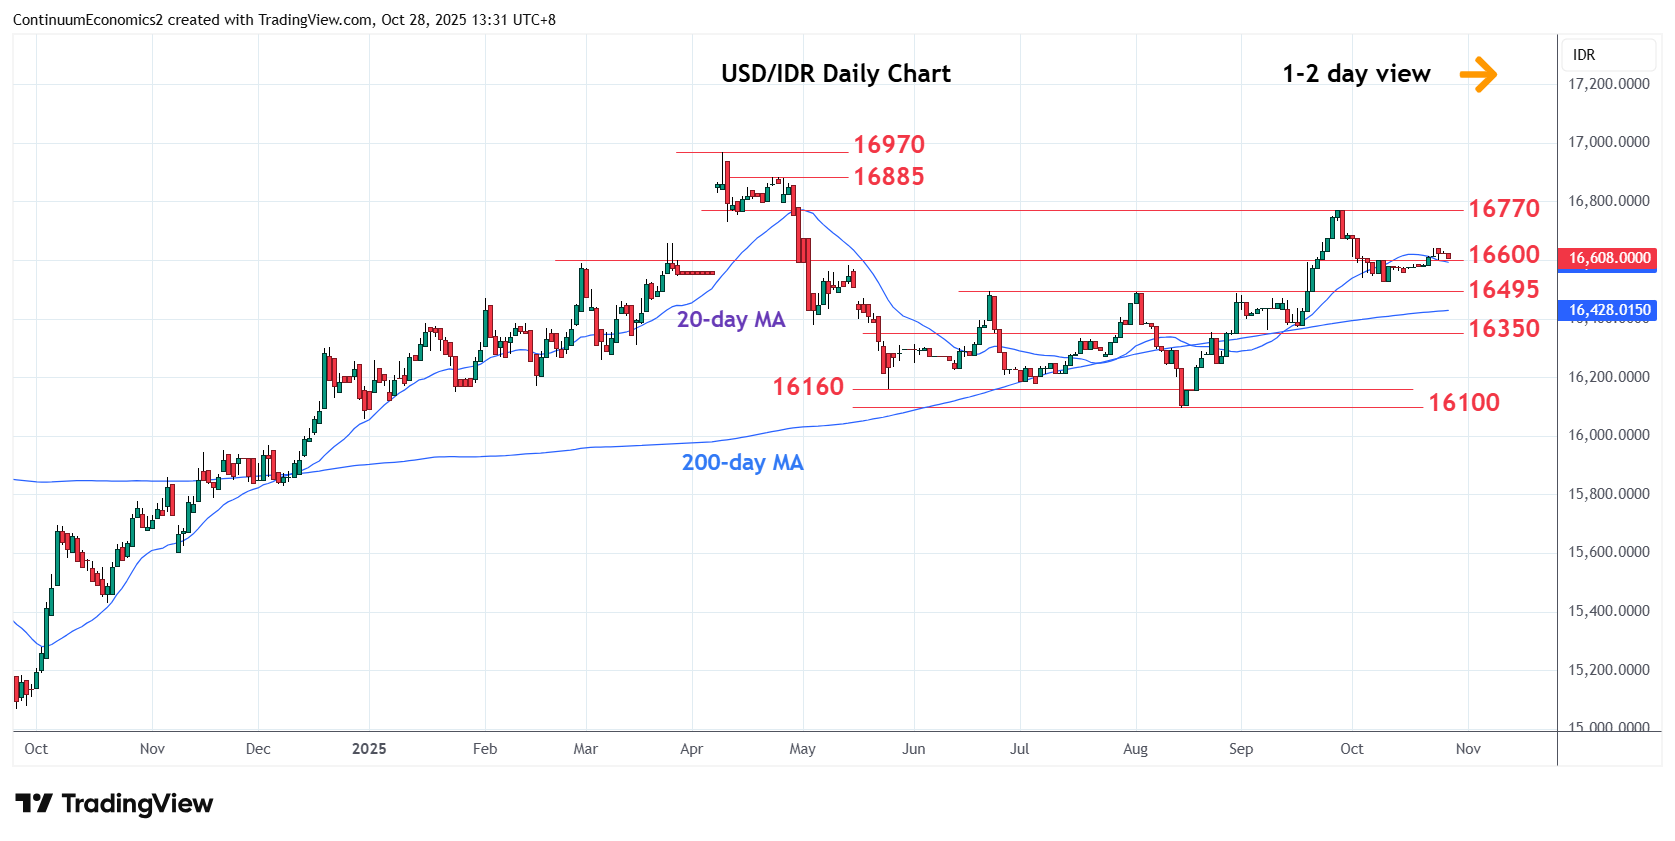
Settling back from gains to 16640 corrective high as prices unwind overbought daily and weekly studies
| Levels | Imp | Comment | Levels | Imp | Comment | |||
|---|---|---|---|---|---|---|---|---|
| R4 | 16800 | * | congestion | S1 | 16600 | * | congestion | |
| R3 | 16770 | ** | 26 Sep high | S2 | 16525 | * | 9 Oct low | |
| R2 | 16700 | * | figure | S3 | 16495 | ** | Jun high | |
| R1 | 16640 | * | 23 Oct high | S4 | 16355/350 | * | 61.8%, congestion |
Asterisk denotes strength of level
05:35 GMT - Settling back from gains to 16640 corrective high as prices unwind overbought daily and weekly studies. Pullback see support starting at the 16600 congestion and below this will see room for pullback to the 16525 low. A later break here will open up room for deeper pullback to retrace the August/September rally to strong support at the 16495, June-August range highs. Lower still will see room to 16355/16350 area. Meanwhile, resistance at the 16640 high now expected to cap and contain corrective bounce.