Published: 2026-04-30T05:18:15.000Z
Chart USD/INR Update: Break to record high
1
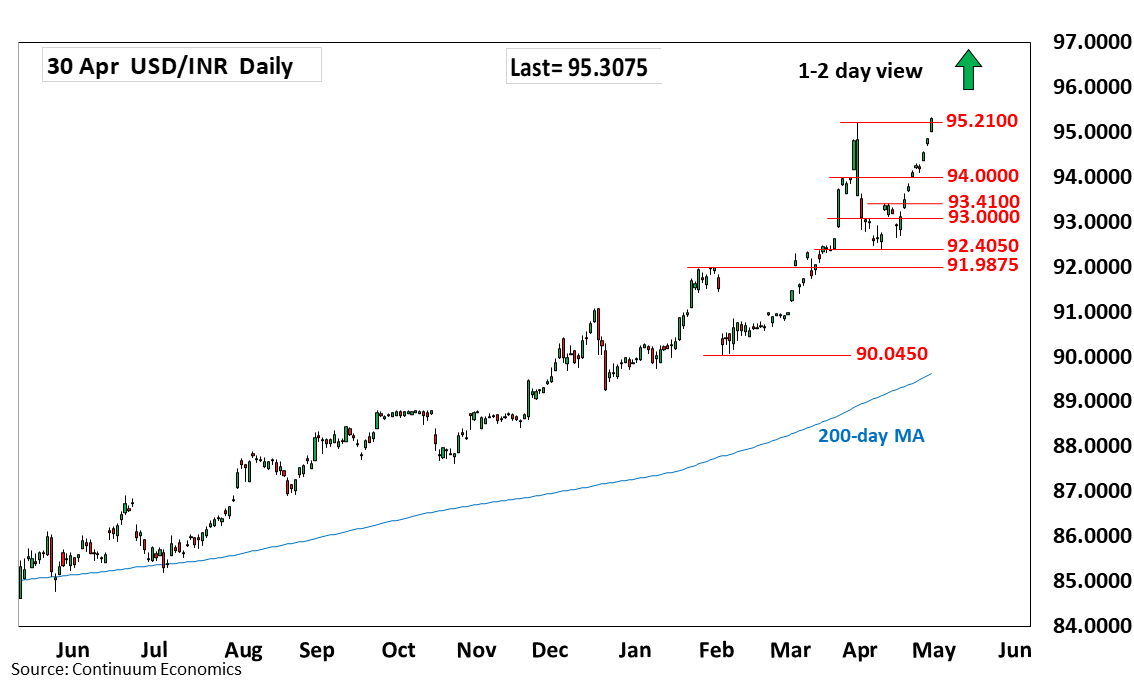
Break above the 94.0000 level see prices extending parabolic gains from the 10 April low at 92.4050 to reach fresh record high at 95.3300
| Level | Comment | Level | Comment | |||||
|---|---|---|---|---|---|---|---|---|
| R4 | 96.0000 | figure | S1 | 94.3050 | * | 24 Apr high | ||
| R3 | 95.5000 | figure | S2 | 94.0000 | ** | figure, congestion | ||
| R2 | 95.3850 | projection | S3 | 93.4100 | ** | 15 Apr high | ||
| R1 | 95.3300 | intraday high | S4 | 93.0000 | * | figure |
Asterisk denotes strength of level
05:15 GMT - Break above the 94.0000 level see prices extending parabolic gains from the 10 April low at 92.4050 to reach fresh record high at 95.3300. Higher, will see scope to retest the 95.3850 projection target and 95.5000 level. Beyond this will see room to the 96.0000 figure. Meanwhile, support is raised to 94.3050 high of last week and extending to the 94.0000 level. This area should underpin and see break here needed to ease the upside pressure and see room for deeper pullback to strong support at the 93.4100, 15 April high.