Published: 2025-10-03T07:01:47.000Z
Chart USD/MXN Update: Extending consolidation above 18.1960, current year low
2
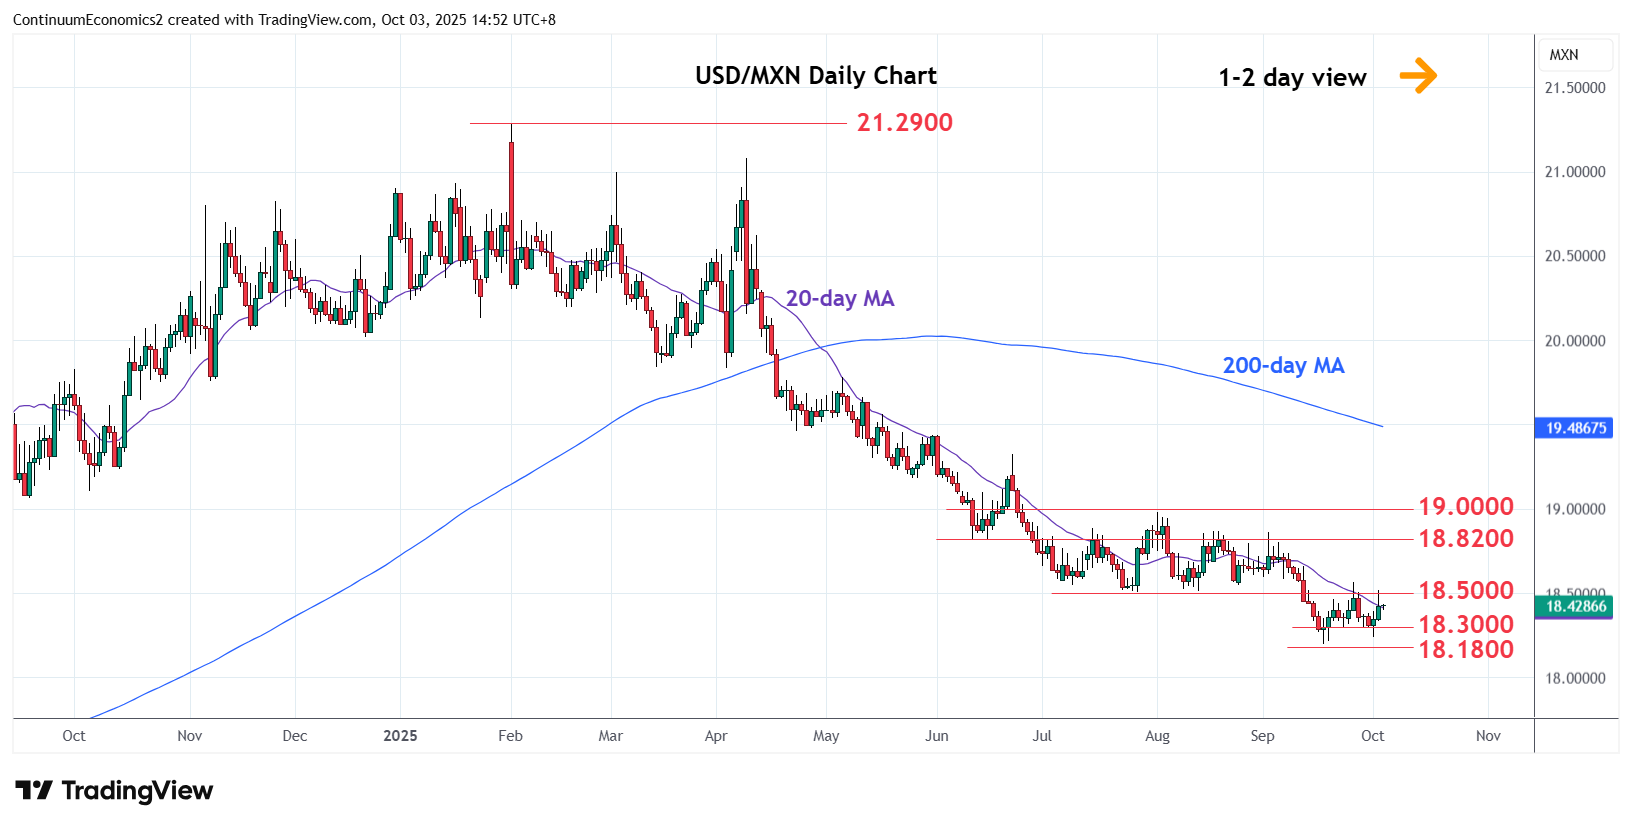
Extending choppy trade above the 18.1960 September current year low
| Levels | Imp | Comment | Levels | Imp | Comment | |||
|---|---|---|---|---|---|---|---|---|
| R4 | 19.0000 | ** | congestion | S1 | 18.3000 | * | 23 Sep low | |
| R3 | 18.8200 | * | 11 Jun low | S2 | 18.1960 | ** | 17 Sep YTD low | |
| R2 | 18.6600 | 11 Sep high | S3 | 18.1800 | * | 61.8% 2024/Feb rally | ||
| R1 | 18.5000 | * | congestion | S4 | 18.0000 | ** | psychological |
Asterisk denotes strength of level
07:00 GMT - Extending choppy trade above the 18.1960 September current year low as prices consolidate losses from the 18.8200/19.0000, August lower highs. Bounce see the July/August range lows now turned resistance and regaining this needed to ease the downside pressure open up room for stronger corrective bounce. Higher will see room to strong resistance at the 18.8200/19.0000 area which is expected to cap. Corrective bounce is expected to give way to selling pressure later to retest 18.1960 low and 18.1800, 61.8% Fibonacci level.