Published: 2026-03-04T02:52:30.000Z
Chart USD/SGD Update: Consolidating below 1.2800, room for higher later
1
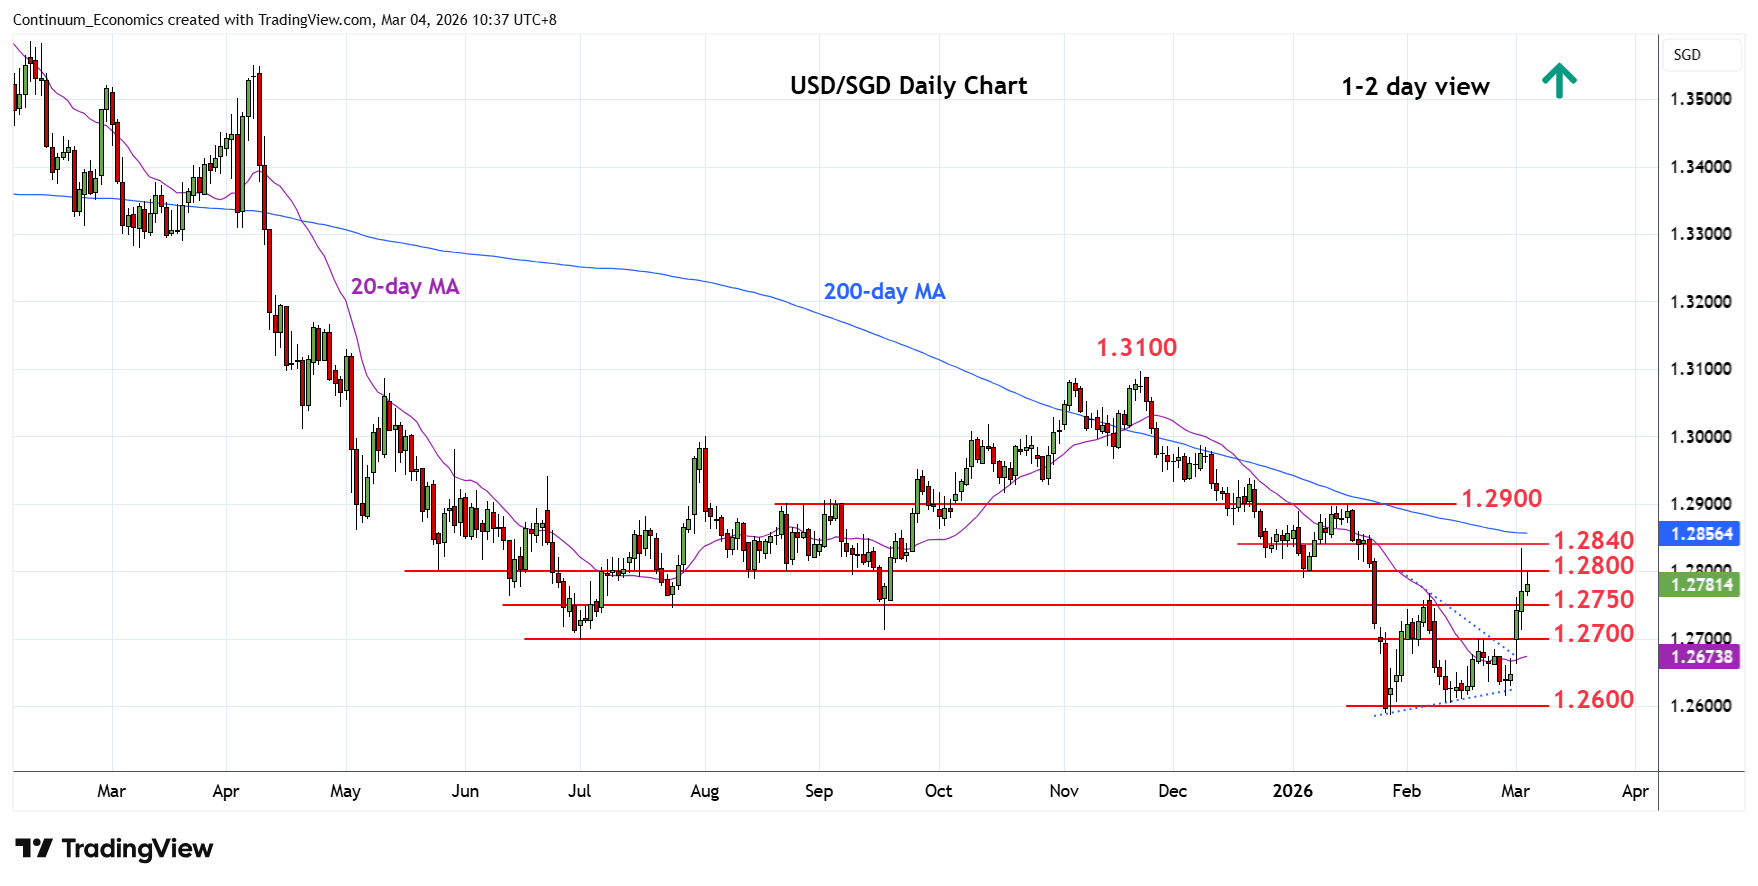
Settled back in consolidation below the 1.2800 level following spike to approach 1.2840 Fibonacci level
| Level | Comment | Level | Comment | ||||
|---|---|---|---|---|---|---|---|
| R4 | 1.2938 | * | 19 Dec high | S1 | 1.2768/50 | * | Feb high, congestion |
| R3 | 1.2900 | ** | 16 Jan YTD high, 61.8% | S2 | 1.2700 | ** | 19 Feb high, congestion |
| R2 | 1.2840 | * | 50% Nov/Jan fall | S3 | 1.2615/00 | * | 26 Feb low, congestion |
| R1 | 1.2800 | * | congestion | S4 | 1.2586 | ** | 28 Jan YTD low |
Asterisk denotes strength of level
02:45 GMT - Settled back in consolidation below the 1.2800 level following spike to approach 1.2840 Fibonacci level as prices unwind overbought intraday studies. Consolidation expected to give way to fresh buying interest later to extend the bullish break of the 1.2768, February high. Above the 1.2834/40 high and Fibonacci level will see room for extension to retest the 1.2900, January current year high 61.8% Fibonacci level. Meanwhile, support is raised to the 1.2768/50, February high and congestion area, which should underpin and sustain bounce from the 1.2600/1.2586 lows.