Published: 2026-02-24T03:02:58.000Z
Chart USD/CNH Update: Consolidating above 6.8800 low
1
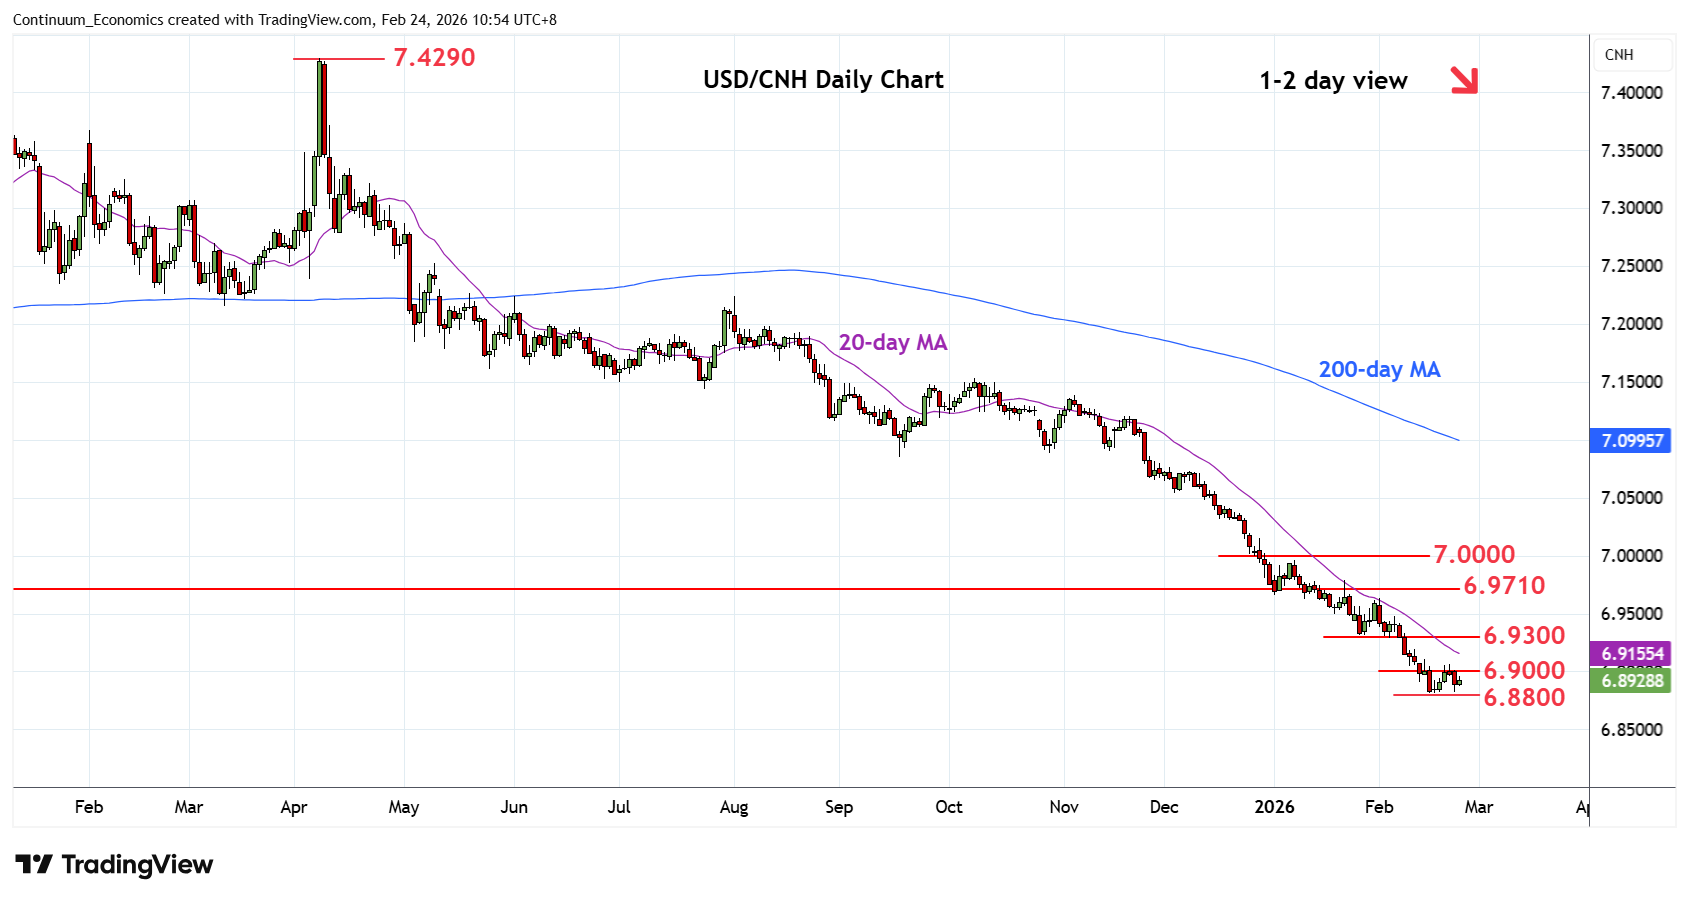
Still heavy, with prices just shy of the 6.8800 low but daily studies are mixed and suggest the latter should keep losses in check for now
| Level | Imp | Comment | Level | Imp | Comment | |||
|---|---|---|---|---|---|---|---|---|
| R4 | 6.9710/50 | ** | 2024/2025 year lows | S1 | 6.8800 | ** | 16 Feb YTD low | |
| R3 | 6.9500 | * | congestion | S2 | 6.8700 | * | 76.4% 2023/2025 rally | |
| R2 | 6.9300 | * | Jan low, congestion | S3 | 6.8500 | * | congestion | |
| R1 | 6.9100 | * | 13 Feb high | S4 | 6.8100 | * | Mar 2023 low |
Asterisk denotes strength of level
03:00 GMT - Still heavy, with prices just shy of the 6.8800 low but daily studies are mixed and suggest the latter should keep losses in check for now. Deep oversold weekly studies caution corrective bounce but a later break here will further extend losses from April 2025 year high and see room to target 6.8700, 76.4% Fibonacci level, and 6.8500 congestion. Meanwhile, resistance at the 6.9000/6.9100 area is expected to cap. Would need to clear this to open up room for bounce to 6.9300/6.9500 congestion and strong resistance at 6.9710/6.9750, 2024 and 2025 year lows.