Published: 2026-01-26T02:57:24.000Z
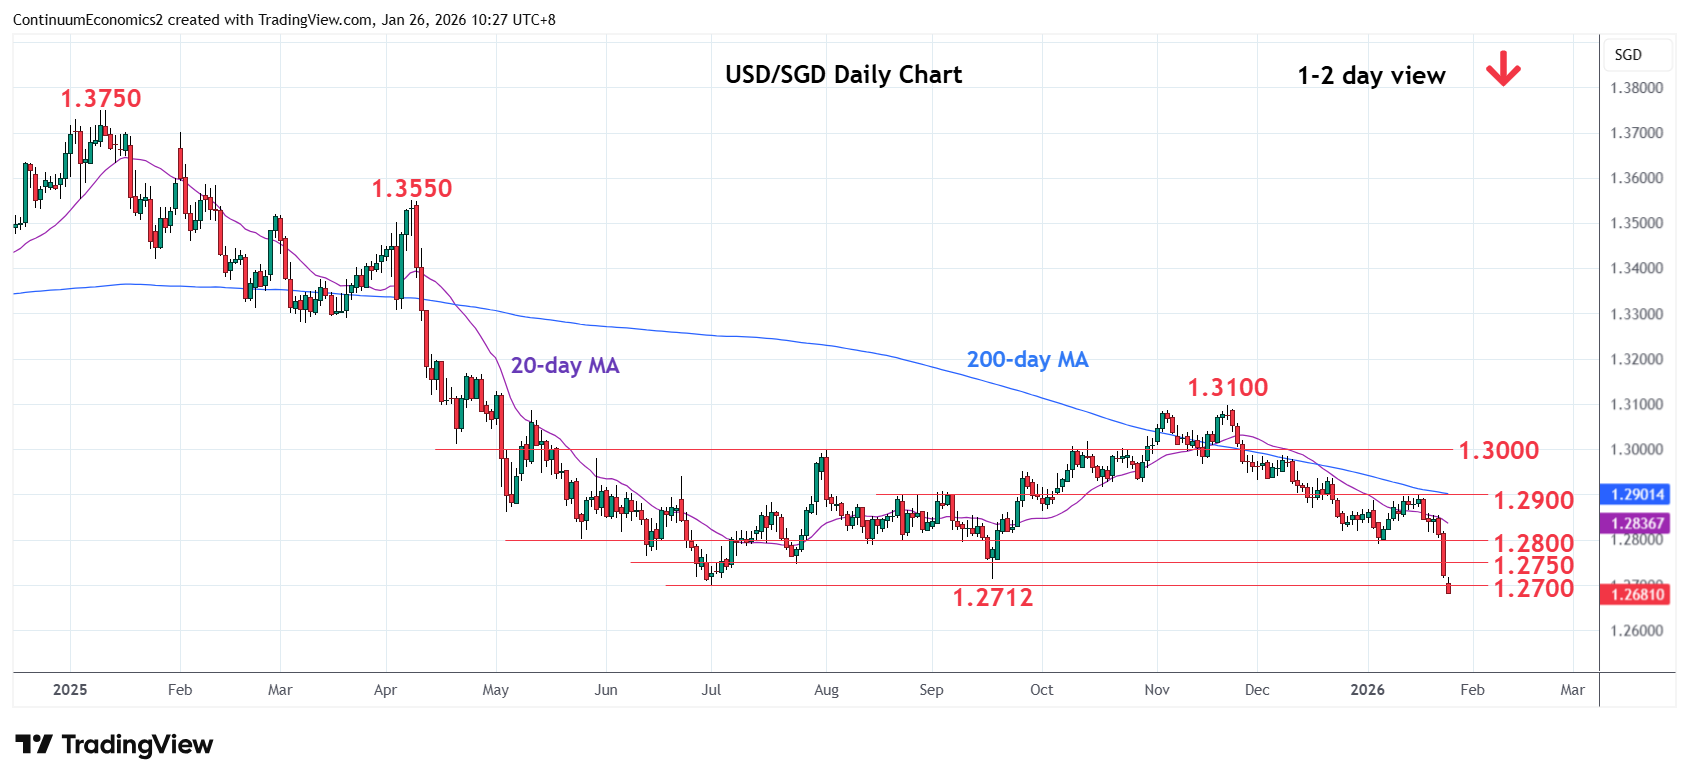
Chart USD/SGD Update: Break to fresh low through 1.2700, 2025 year low
-
Extending sharp losses last week to see follow-through below the 1.2712/1.2700, 2025 year low
| Level | Comment | Level | Comment | ||||
|---|---|---|---|---|---|---|---|
| R4 | 1.2900 | ** | 16 Jan high, congestion | S1 | 1.2675 | * | Oct 2014 low |
| R3 | 1.2850 | * | congestion | S2 | 1.2620 | * | 76.4% 2011/2020 rally |
| R2 | 1.2790/00 | ** | 6 Jan low, congestion | S3 | 1.2600 | * | congestion |
| R1 | 1.2750 | * | congestion | S4 | 1.2550 | * | congestion |
Asterisk denotes strength of level
02:45 GMT - Extending sharp losses last week to see follow-through below the 1.2712/1.2700, 2025 year low. Fresh low has reached the 1.2675 support from October 2014 low. Below this will see room for continuation lower to support at 1.2620/00, 76.4% Fibonacci level and congestion area. Oversold daily and weekly studies caution corrective bounce but the upside likely to remain limited with resistance starting at 1.2750. Break here will open up room for stronger corrective bounce to strong resistance at 1.2790/1.2800, 6 January low and congestion area.