Published: 2026-03-31T03:54:04.000Z
Chart USD/CNH Update: Drifting below 6.9300 resistance
1
Little change, as prices extend consolidation beneath the 6.9300 resistance
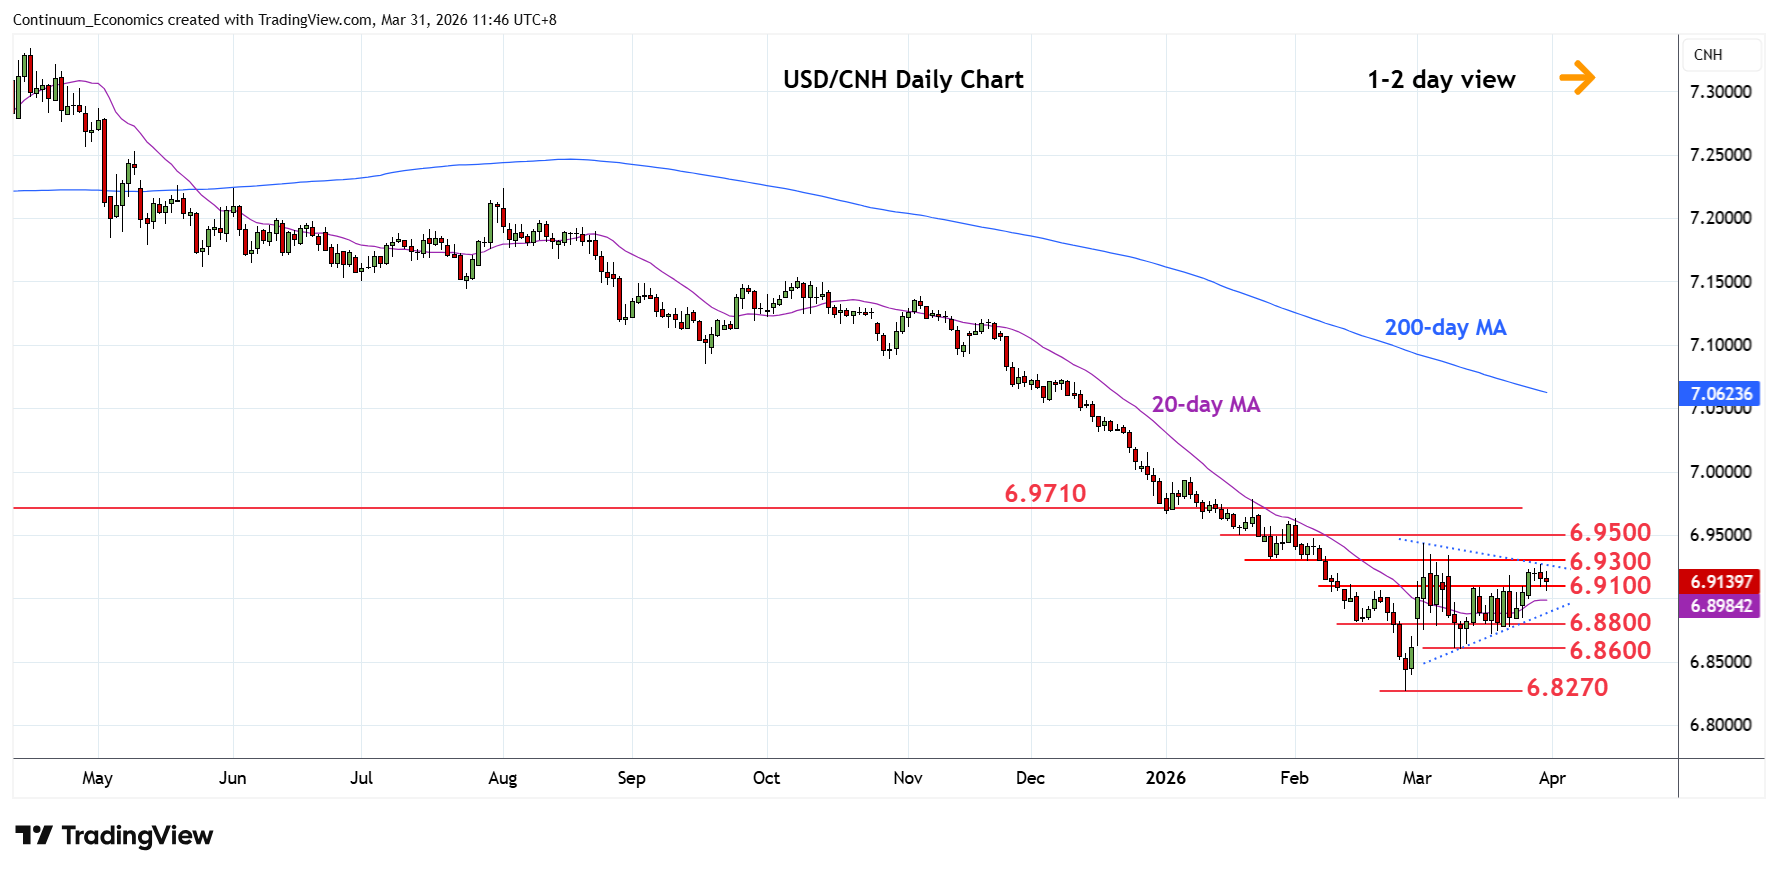
| Level | Imp | Comment | Level | Imp | Comment | |||
|---|---|---|---|---|---|---|---|---|
| R4 | 6.9910 | * | 50% Oct/Feb fall | S1 | 6.9100 | * | congestion | |
| R3 | 6.9710 | * | 2024 year low | S2 | 6.8800 | * | 16 Feb low, congestion | |
| R2 | 6.9500 | * | congestion, 38.2% | S3 | 6.8600 | ** | 11 Mar low | |
| R1 | 6.9300 | ** | Jan low, congestion | S4 | 6.8270 | ** | 26 Feb YTD low |
Asterisk denotes strength of level
03:50 GMT - Little change, as prices extend consolidation beneath the 6.9300 resistance. Both daily and weekly studies remains positive but are overbought and caution pullback to support at the 6.9100/6.9000 congestion area. Break here will fade the upside pressure and see room for pullback to support at the 6.8800/6.8600 area. Below these will return focus to the 6.8270 February YTD low. Meanwhile, resistance at the 6.9300/6.9500 congestion and 38.2% Fibonacci retracement now expected to cap. Clearance will extend the February gains and further retrace losses from the October high.