Published: 2026-05-06T02:26:54.000Z
Chart USD/SGD Update: Leaning lower in range
-
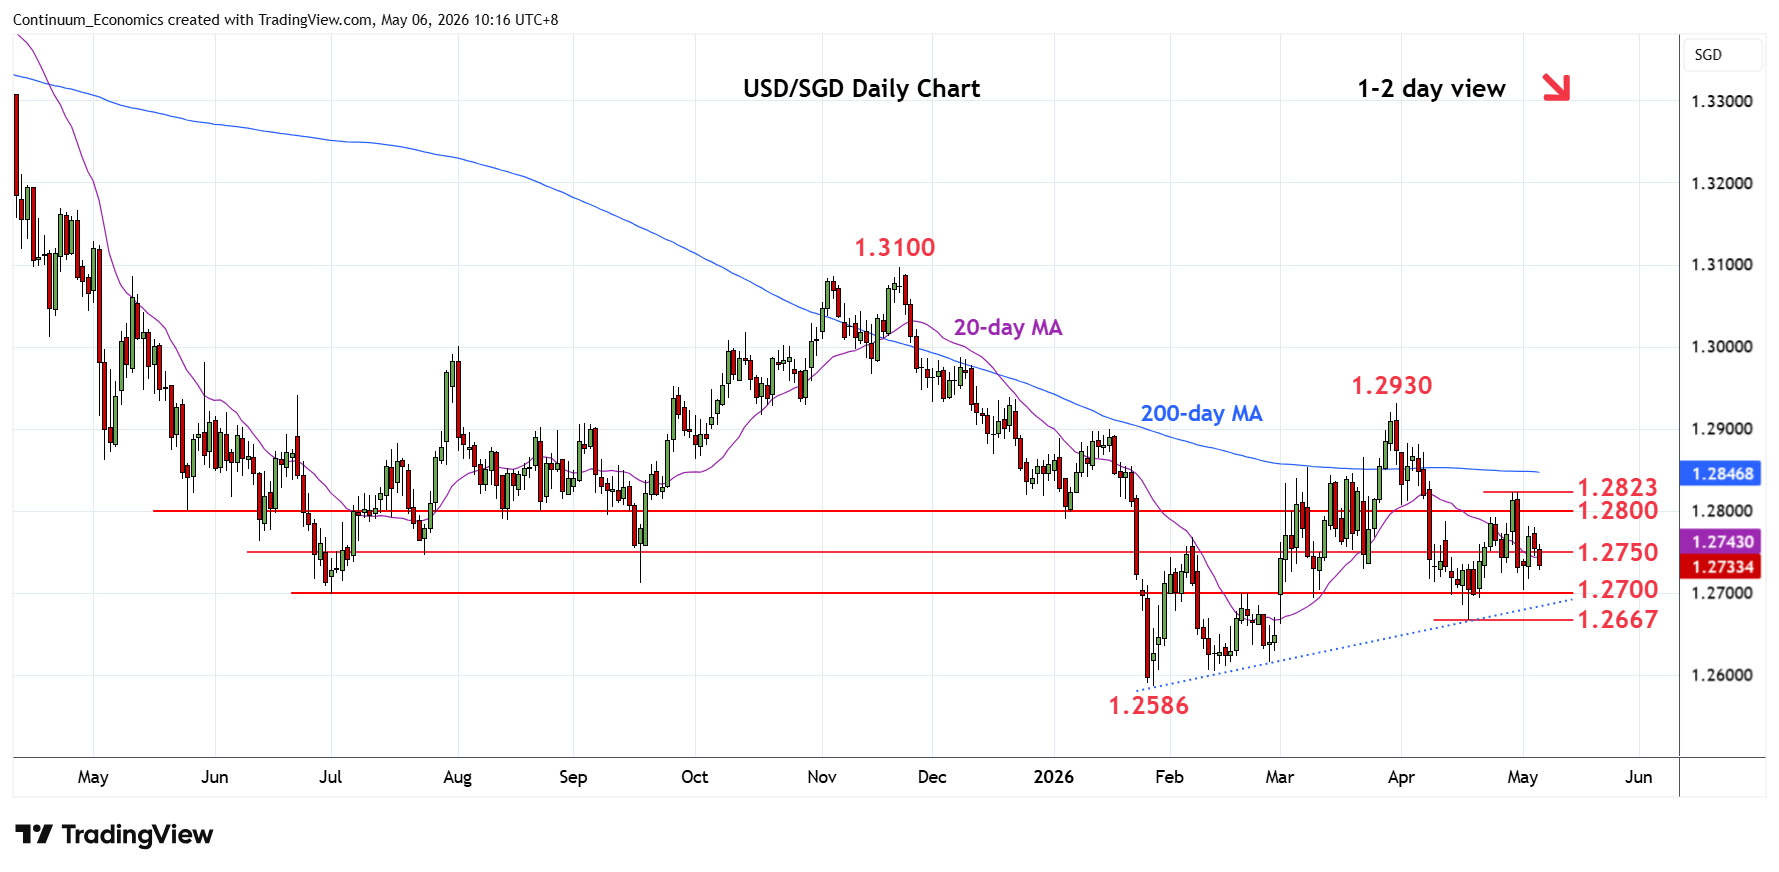
Lower in range from the 1.2780 Monday's high
| Level | Comment | Level | Comment | ||||
|---|---|---|---|---|---|---|---|
| R4 | 1.2900 | * | congestion | S1 | 1.2700 | ** | 19 Feb high, 2025 yr low |
| R3 | 1.2850 | * | congestion, 200-day MA | S2 | 1.2667 | ** | Apr low |
| R2 | 1.2800/23 | ** | congestion, 29 Apr high | S3 | 1.2650 | * | congestion |
| R1 | 1.2780 | * | 4 May high | S4 | 1.2586 | ** | 28 Jan YTD low |
Asterisk denotes strength of level
02:20 GMT - Lower in range from the 1.2780 Monday's high and return below support at 1.2750 congestion threatens deeper pullback to retest the 1.2700 support. Break here will expose the April low at 1.2667 to retest. Below here will return focus to the downside for retest of the 1.2600 level and 1.2586 current year low of 28 January. Meanwhile, resistance is lowered to the 1.2780 Monday's bounce high which is expected to cap and sustain losses from the 1.2823, 29 April high.