Published: 2026-02-27T03:11:26.000Z
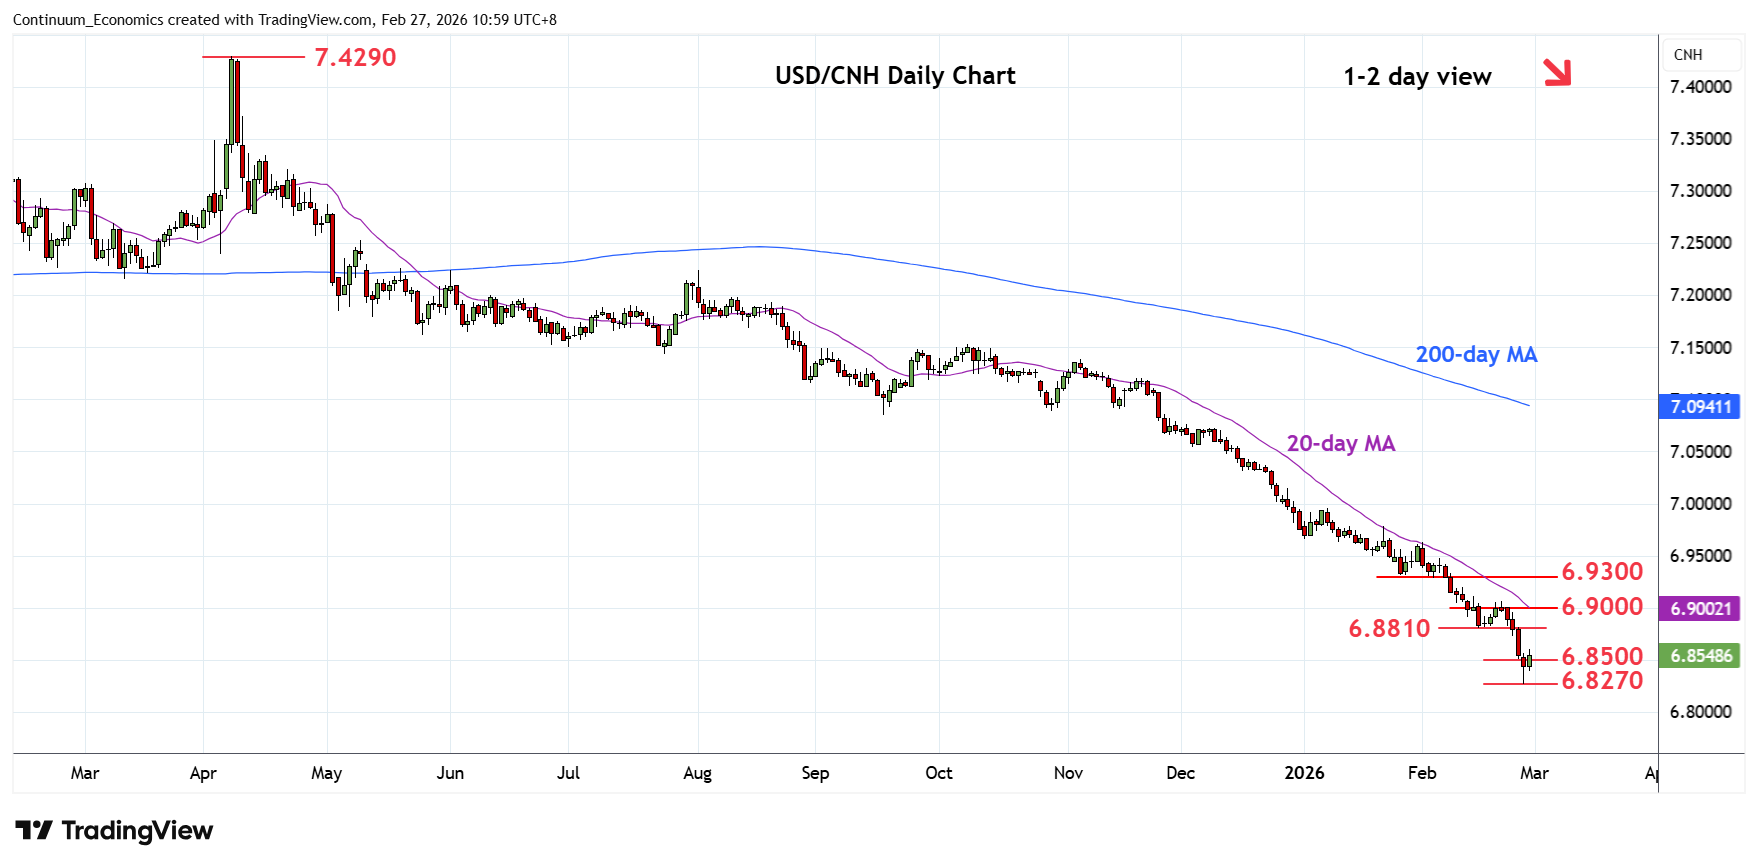
Chart USD/CNH Update: Consolidating sharp losses
1
Steadied at the 6.8270 low to consolidate at the 6.8500 level as prices unwind oversold intraday studies
| Level | Imp | Comment | Level | Imp | Comment | |||
|---|---|---|---|---|---|---|---|---|
| R4 | 6.9000/65 | ** | congestion, 20 Feb high | S1 | 6.8270 | ** | 26 Feb YTD low | |
| R3 | 6.8800/10 | ** | congestion, 16 Feb low | S2 | 6.8100 | * | Mar 2023 low | |
| R2 | 6.8700 | * | congestion | S3 | 6.8000 | ** | figure, congestion | |
| R1 | 6.8500 | congestion | S4 | 6.7750 | * | congestion |
Asterisk denotes strength of level
03:00 GMT - Steadied at the 6.8270 low to consolidate at the 6.8500 level as prices unwind oversold intraday studies. Daily and weekly studies are stretched as well and caution corrective bounce to correct recent sharp losses from the 6.9960 January current year high and the broader losses from April 2025 year high. Meanwhile, resistance is at 6.8700 congestion and this extend to the 6.8800/10 area which is expected to cap. Would need to regain this to open up room for bounce to strong resistance at 6.9000 and 6.9300 area.