Published: 2026-01-14T03:13:11.000Z
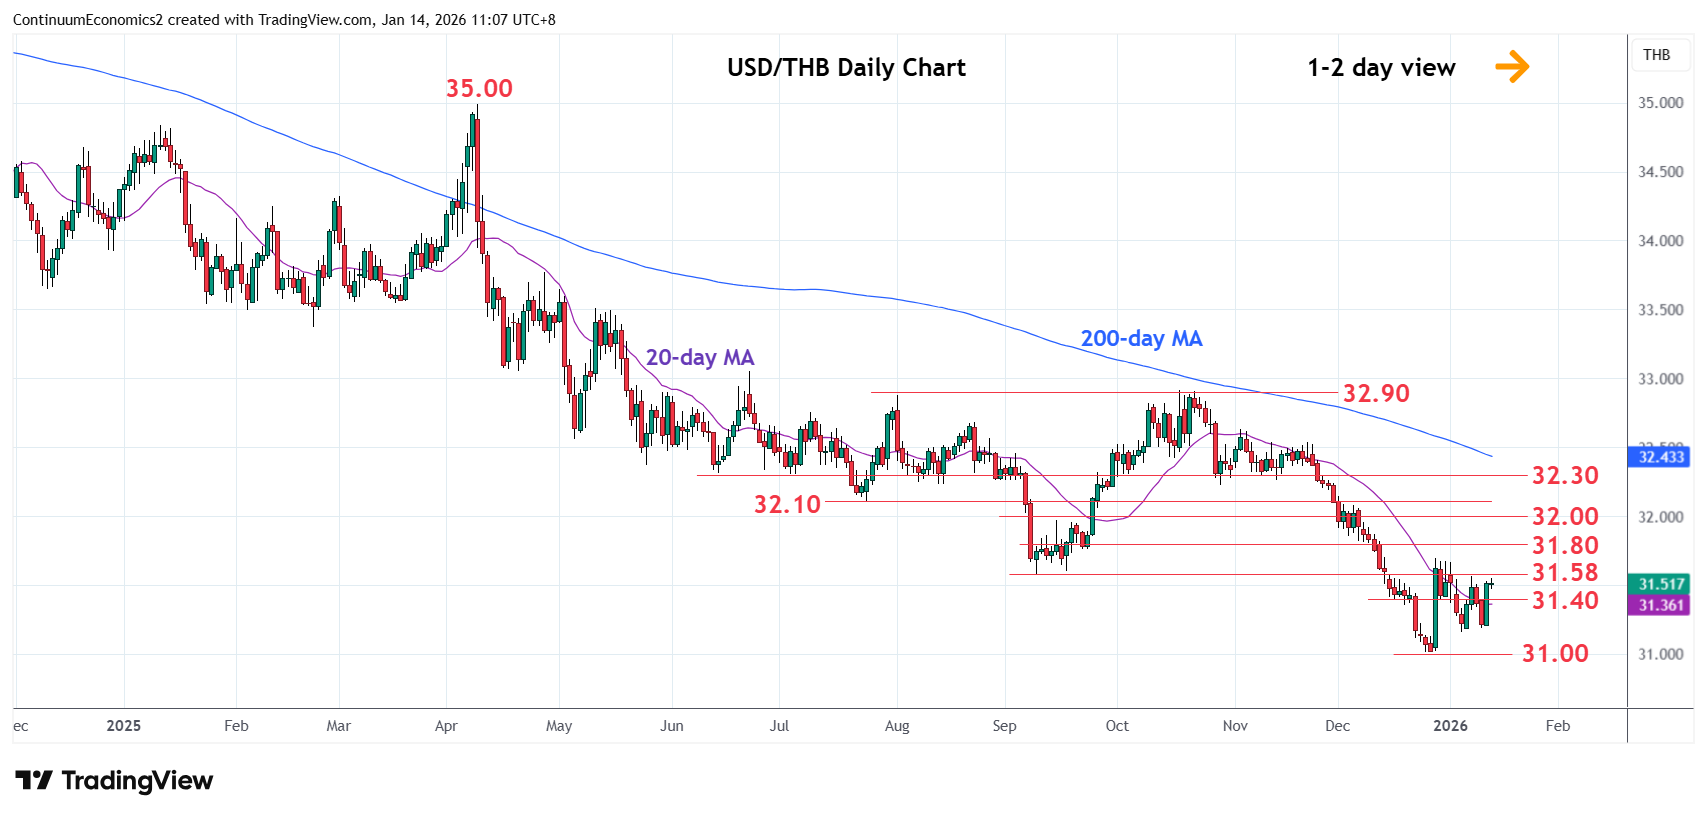
Chart USD/THB Update: Higher in consolidation from 31.00 low
-
Higher in consolidation as prices extend choppy trade above the 31.00 low of last year
| Level | Comment | Level | Comment | |||||
|---|---|---|---|---|---|---|---|---|
| R4 | 32.00 | * | figure, congestion | S1 | 31.16 | * | 6 Jan low | |
| R3 | 31.80 | * | congestion | S2 | 31.00 | ** | 26 Dec 2025 year low | |
| R2 | 31.70 | ** | 29 Dec high | S3 | 30.80 | * | Jun 2020 low | |
| R1 | 31.58 | * | Sep low | S4 | 30.60 | * | congestion |
Asterisk denotes strength of level
03:10 GMT - Higher in consolidation as prices extend choppy trade above the 31.00 low of last year. Bounce from the latter see pressure returning to the 31.58 resistance. Break here and the 31.70 late-December high will open up room for stronger gains to correct losses from the October swing high. Meanwhile, support at the 31.16 now underpin and sustain bounce from the 31.00 low. Would take break of these to extend the broader losses from the September 2022 year high and see extension to support at the 30.80/30.60 congstion area.