Published: 2025-12-23T05:14:00.000Z
Chart USD/INR Update: Higher in consolidation from 89.2500 low
1
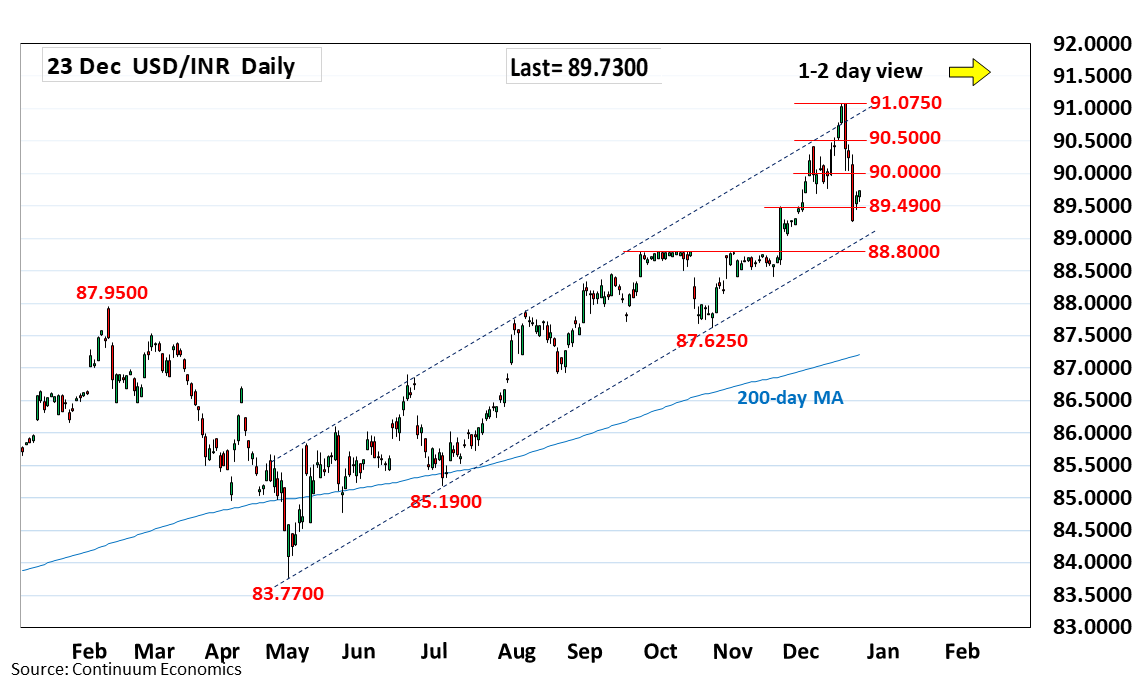
Edged higher from the 89.2500 low as prices consolidate sharp losses from the 91.0750 record high
| Level | Comment | Level | Comment | |||||
|---|---|---|---|---|---|---|---|---|
| R4 | 91.0750 | ** | 16 Dec all-time high | S1 | 89.2500 | 19 Dec low | ||
| R3 | 90.5000 | * | congestion | S2 | 89.0000 | * | figure | |
| R2 | 90.4200 | ** | 4 Dec high | S3 | 88.8000 | ** | Sep high | |
| R1 | 90.0000 | * | congestion | S4 | 88.5000 | * | congestion |
Asterisk denotes strength of level
05:10 GMT - Edged higher from the 89.2500 low as prices consolidate sharp losses from the 91.0750 record high. Daily and weekly studies are tracking lower and suggest consolidation giving way to renewed selling pressure later to retrace gains from the 87.6250, October low. Lower will see room to support at the 89.0000 level then the strong support at 88.8000, September high. Meanwhile, resistance is lowered to the 90.0000 level which is expected to cap and sustain sharp losses from the 91.0750 record high.