Published: 2026-03-26T05:53:59.000Z
Chart USD/IDR Updates: Weighing on 16900/16885 support
3
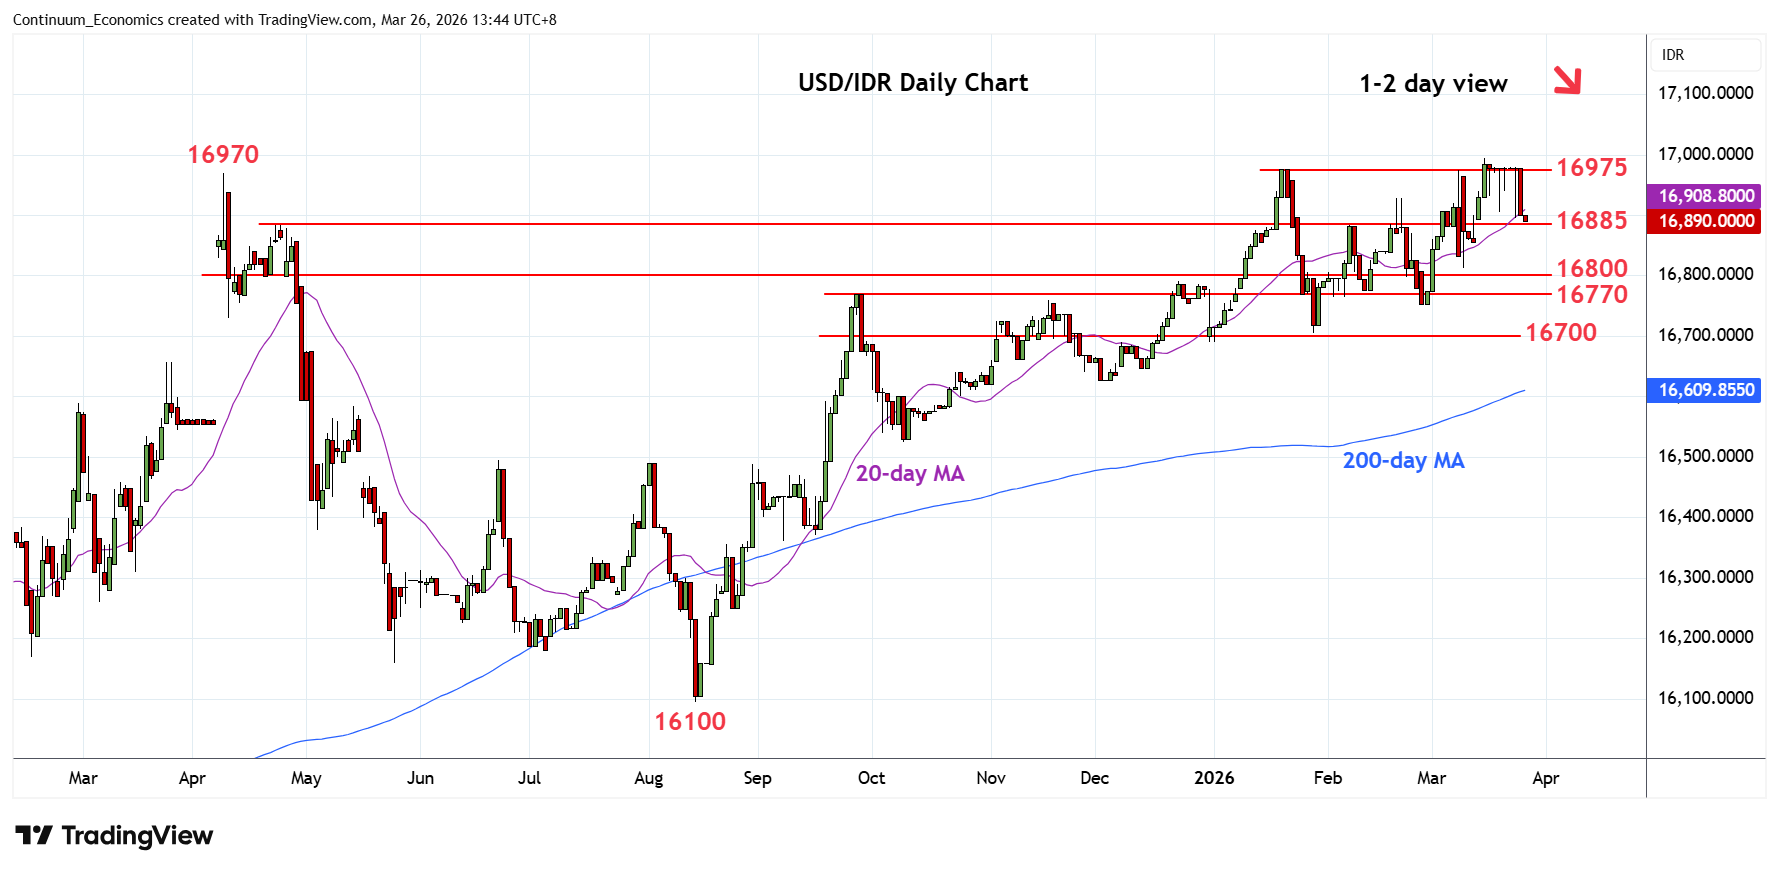
Under pressure as prices extend rejection from the 16995 all-time high to reach the 16900/16885 support
| Levels | Imp | Comment | Levels | Imp | Comment | |||
|---|---|---|---|---|---|---|---|---|
| R4 | 17600 | projection | S1 | 16885 | * | congestion | ||
| R3 | 17200 | projection | S2 | 16800 | * | congestion | ||
| R2 | 16995 | ** | 16 Mar high | S3 | 16755 | ** | Feb low | |
| R1 | 16975 | * | Jan high | S4 | 16705 | ** | 28 Jan YTD low |
Asterisk denotes strength of level
05:45 GMT - Under pressure as prices extend rejection from the 16995 all-time high to reach the 16900/16885 support. Daily studies have turned down from overbought areas and threatens break here to open up room for deeper pullback to retrace strong gains from the 16100 August low. Lower will see room to support at the 16800 congestion and 16770, September high. Below these, will see room for extension to retest 16755/16705, February and January lows. Meanwhile, resistance at the 16975 and 16995 highs are expected to cap.