Published: 2026-04-23T02:59:18.000Z
Chart USD/THB Update: Extending corrective bounce
1
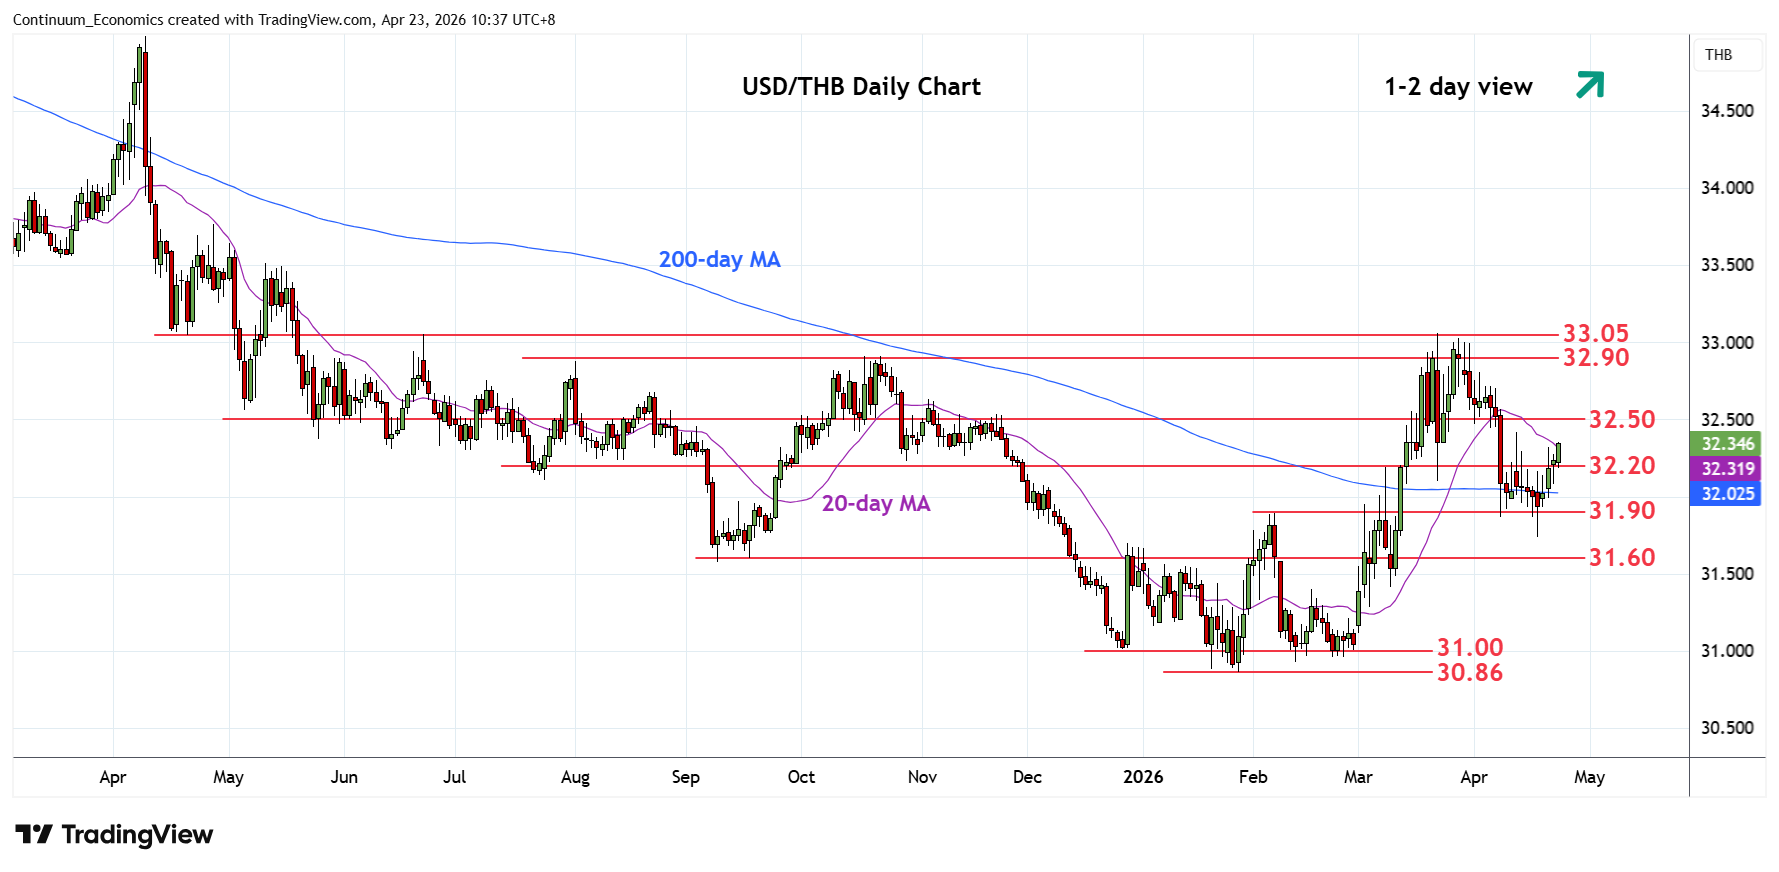
Extending bounce from above the 31.70 support as prices retrace losses from the 33.05 March current year high
| Level | Comment | Level | Comment | |||||
|---|---|---|---|---|---|---|---|---|
| R4 | 33.05 | ** | Jun 2025 high | S1 | 32.20 | * | congestion | |
| R3 | 32.90 | * | congestion | S2 | 31.90 | ** | Feb high | |
| R2 | 32.70 | * | congestion | S3 | 31.70 | * | 61.8% Jan/Mar rally | |
| R1 | 32.40/50 | ** | congestion | S4 | 31.60/58 | ** | congestion, 2025 yr low |
Asterisk denotes strength of level
03:00 GMT - Extending bounce from above the 31.70 support as prices retrace losses from the 33.05 March current year high. Break above resistance at the 32.20 congestion see room to strong resistance at the 32.40/50 congestion which is expected to cap. Corrective bounce expected to give way renewed selling pressure later to retest the 31.90 support. Below this will further retrace the January/March rally and see room to 31.70, 61.8% Fibonacci retracement. Lower still, will see extension to strong support at the 31.60/31.58, congestion and 2025 year low.