Published: 2026-02-24T05:45:15.000Z
Chart USD/IDR Updates: Consolidating test of 16800 support
2
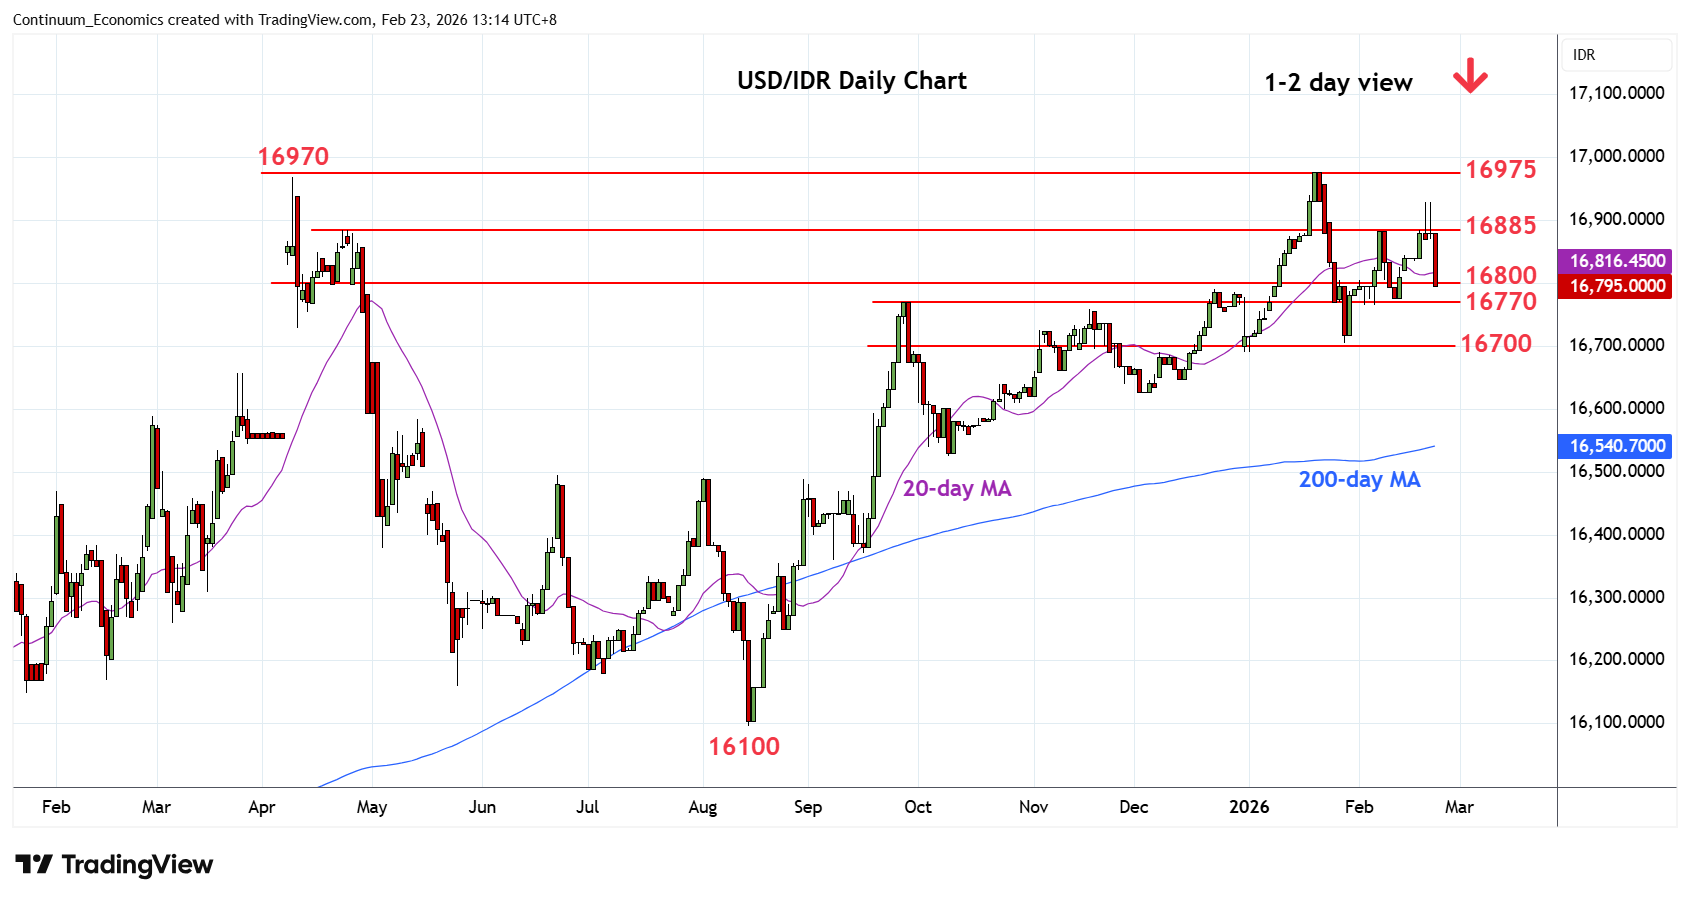
Rejection from the 16930 high has seen sharp pullback to reach support at the 16800 level
| Levels | Imp | Comment | Levels | Imp | Comment | |||
|---|---|---|---|---|---|---|---|---|
| R4 | 17050 | * | extension | S1 | 16800 | * | congestion | |
| R3 | 16975 | ** | 20 Jan all-time high | S2 | 16770 | * | Sep high | |
| R2 | 16930 | * | 19 Feb high | S3 | 16705 | ** | 28 Jan YTD low | |
| R1 | 16885 | * | 6 Feb high | S4 | 16625 | * | 2 Dec low |
Asterisk denotes strength of level
05:35 GMT - Rejection from the 16930 high has seen sharp pullback to reach support at the 16800 level. Negative daily and weekly studies suggest consolidation here giving way to break of the 16770 support to open up room for retest of the 16705, January current year low. Below this will see room for deeper pullback to retrace the August/January gains to support at the 16625/16600 area. Meanwhile, resistance at the 16885 congestion and 16930 high are expected to cap. Only clearance will expose the 16970/16975 highs to retest.