Published: 2026-01-28T04:55:40.000Z
Chart USD/INR Update: Lower in consolidation, but still supported
1
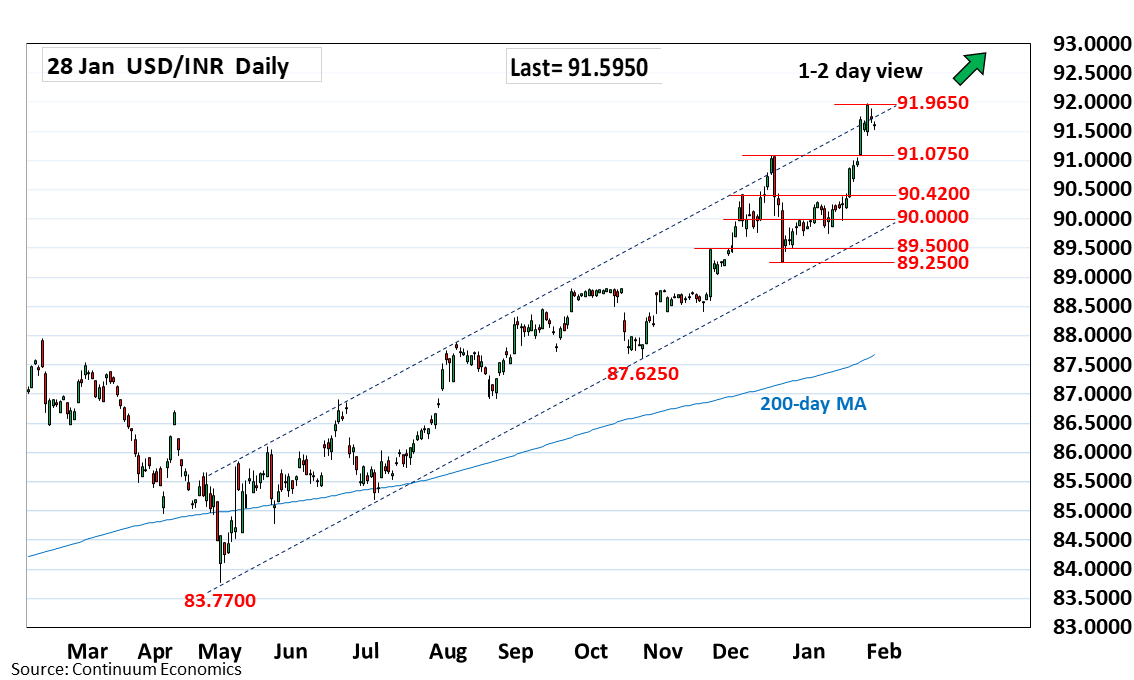
Edged lower in consolidation from 91.9650 historic high as prices unwind overbought intraday studies
| Level | Comment | Level | Comment | |||||
|---|---|---|---|---|---|---|---|---|
| R4 | 92.6500 | * | projection | S1 | 91.5000 | * | congestion | |
| R3 | 92.1300 | * | projection | S2 | 91.0000 | * | figure | |
| R2 | 92.0000 | * | figure | S3 | 90.4200 | * | 4 Dec high | |
| R1 | 91.9650 | * | 23 Jan all-time high | S4 | 90.2900 | ** | 5 Jan high |
Asterisk denotes strength of level
04:50 GMT - Edged lower in consolidation from 91.9650 historic high as prices unwind overbought intraday studies. However, positive daily studies suggest potential to further extend the underlying bull trend. Higher, if seen, will see room to the 92.0000 level and 92.1300 projection target. Meanwhile, support is raised to 91.5000/91.4250 congestion. Would take break here to open up room for deeper pullback to support at the 91.0750/91.0000 area which is expected to underpin. Break here will fade the upside pressure and see room for deeper correction to retrace strong gains from the December low.