Published: 2026-04-28T02:51:39.000Z
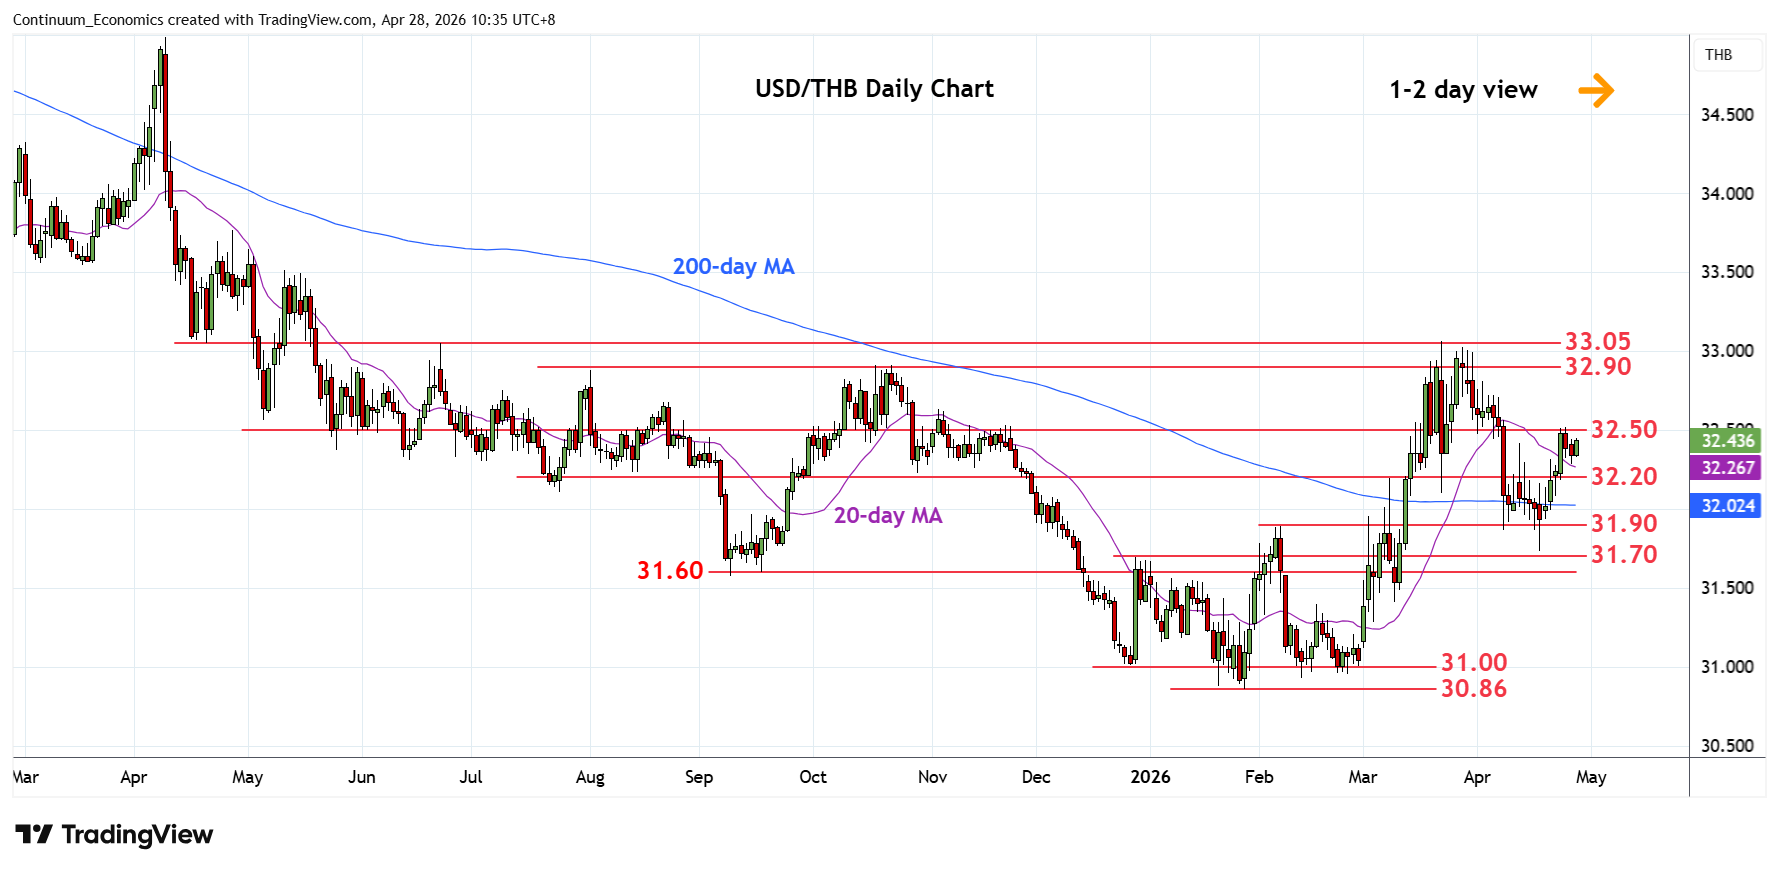
Chart USD/THB Update: Consolidating test of 32.50 resistance
2
Settled into consolidation following test of strong resistance at the 32.40/50 congestion area
| Level | Comment | Level | Comment | |||||
|---|---|---|---|---|---|---|---|---|
| R4 | 33.05 | ** | Jun 2025 high | S1 | 32.20 | * | congestion | |
| R3 | 32.90 | * | Oct high, congestion | S2 | 31.90 | ** | Feb high | |
| R2 | 32.70 | * | congestion | S3 | 31.70 | * | 61.8% Jan/Mar rally | |
| R1 | 32.50 | ** | congestion | S4 | 31.60/58 | ** | congestion, 2025 yr low |
Asterisk denotes strength of level
02:50 GMT - Settled into consolidation following test of strong resistance at the 32.40/50 congestion area. Pullback see support starting at the 32.20 congestion where break is needed to return focus to the downside for retest of strong support at the 31.90 Februry high then the 31.74, 17 April low. Break here will further retrace the January/March rally and see room to 31.70, 61.8% Fibonacci retracement. Meanwhile, resistance at the 32.50 congestion is expected to cap. Break, if seen, will see room for extension to resistance at the 32.70/80 congestion area.